Candle patterns
Identical Three Crows
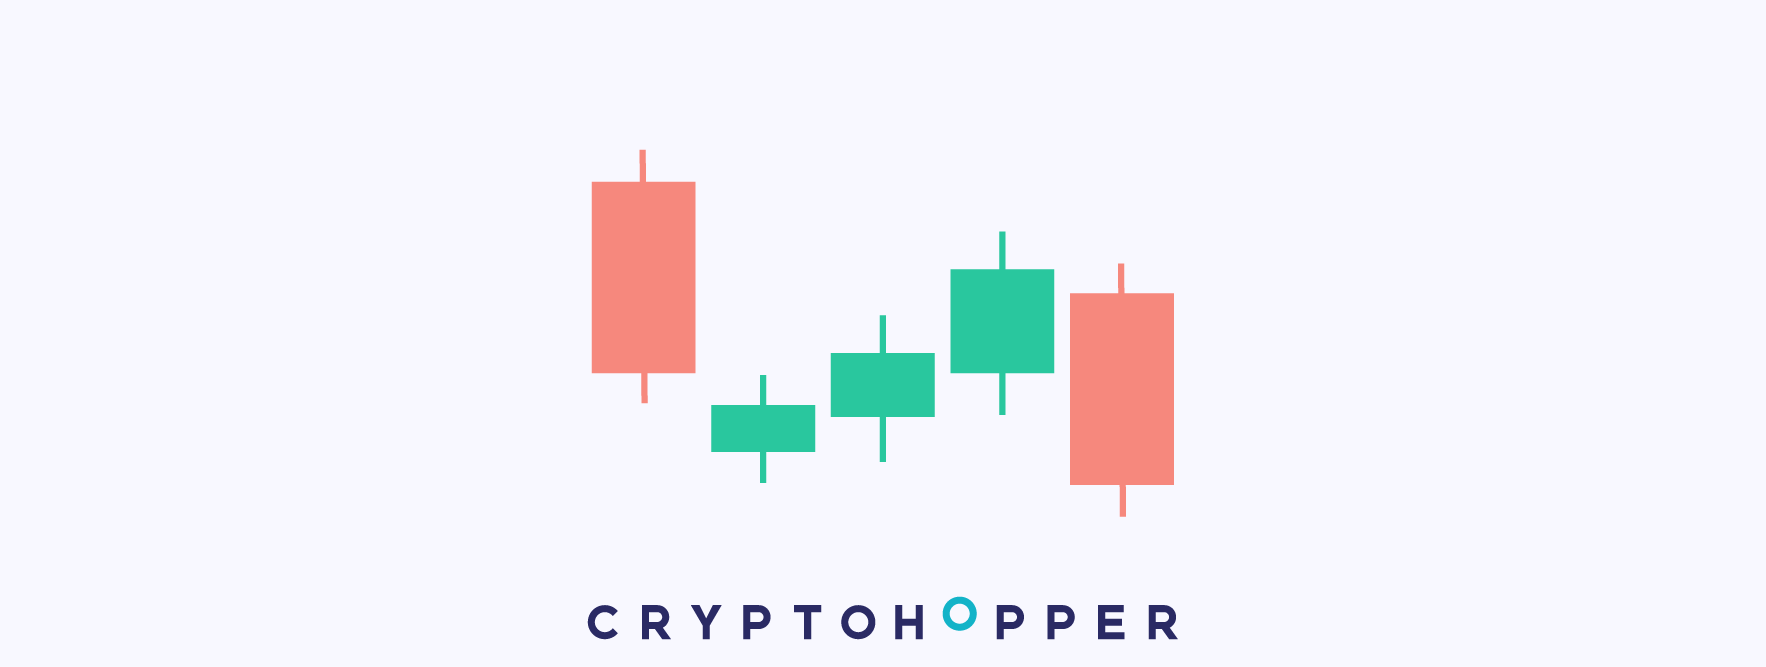
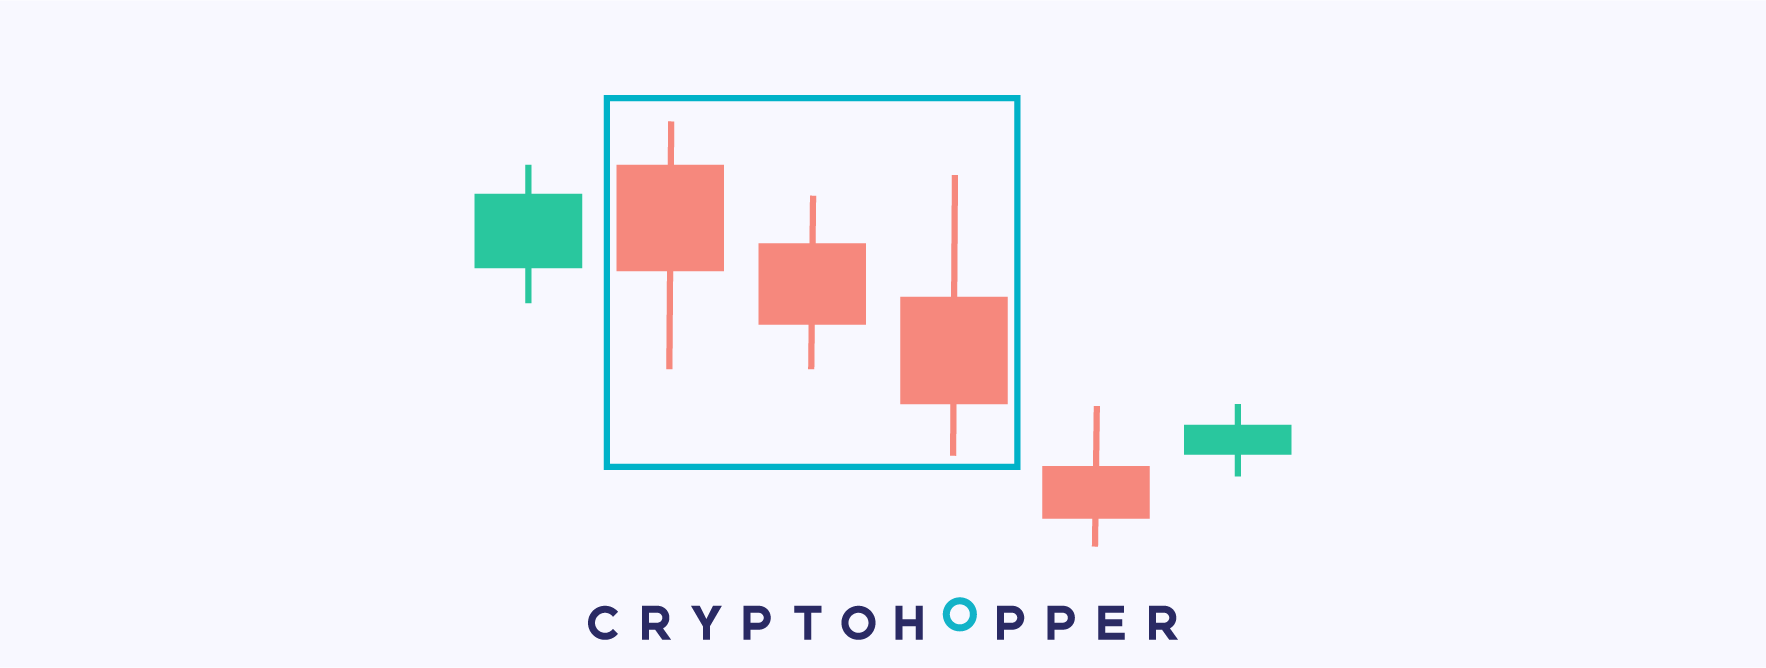 The Identical Three Crows is a bearish pattern represented by three candles.
During an uptrend, the three following candles start decreasing, being their opening price near the close of the prior candle and with similar sizes of the candle and body.
The three candles are very similar in size and head in the same direction, downwards. This pattern shows how, after an uptrend, the bulls react aggressively and push the price down.
Usually, this pattern leads to a bearish trend reversal. Therefore, if selected in your strategy, it will signal sells once it's spotted in a chart.
Abandoned Baby Bearish
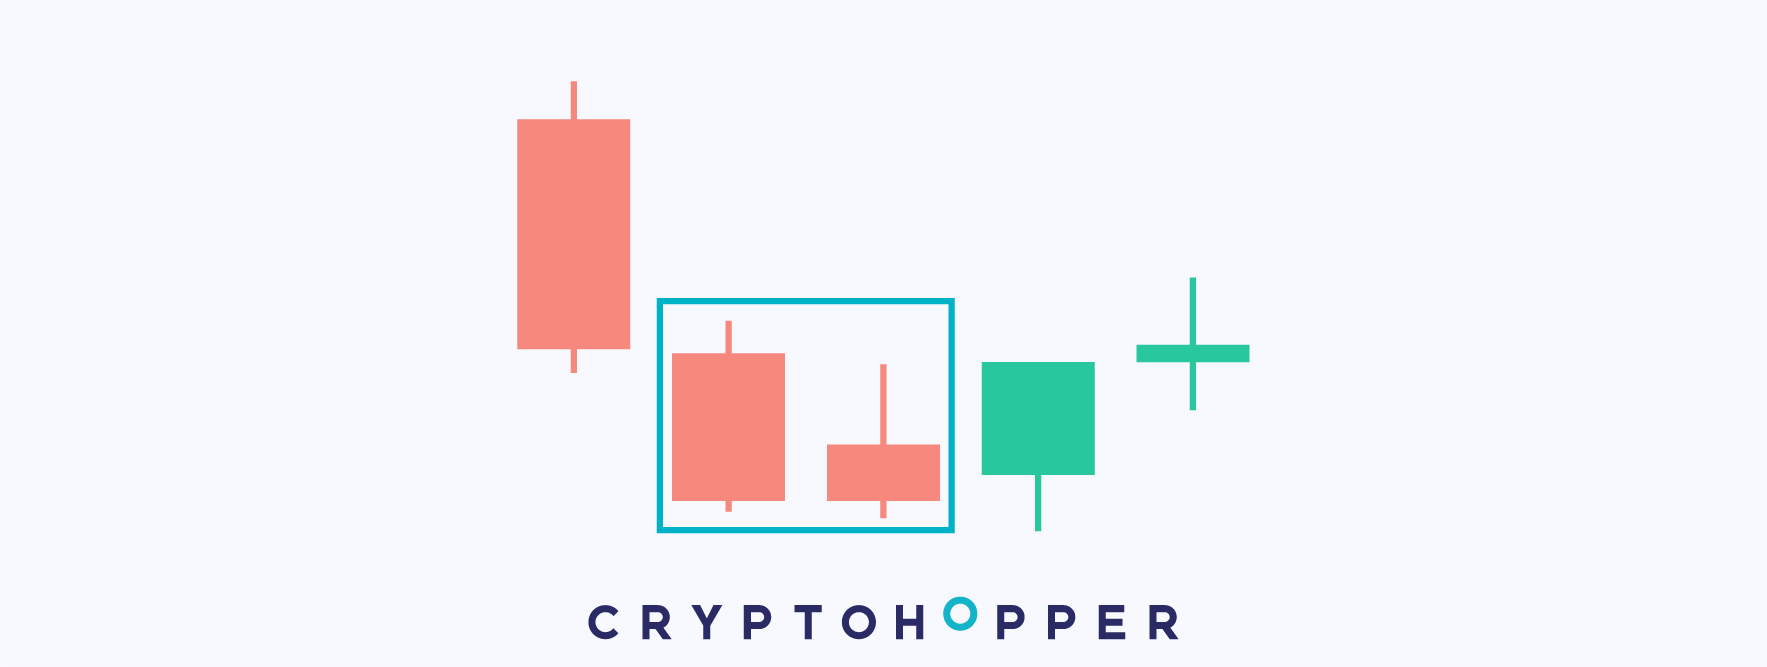
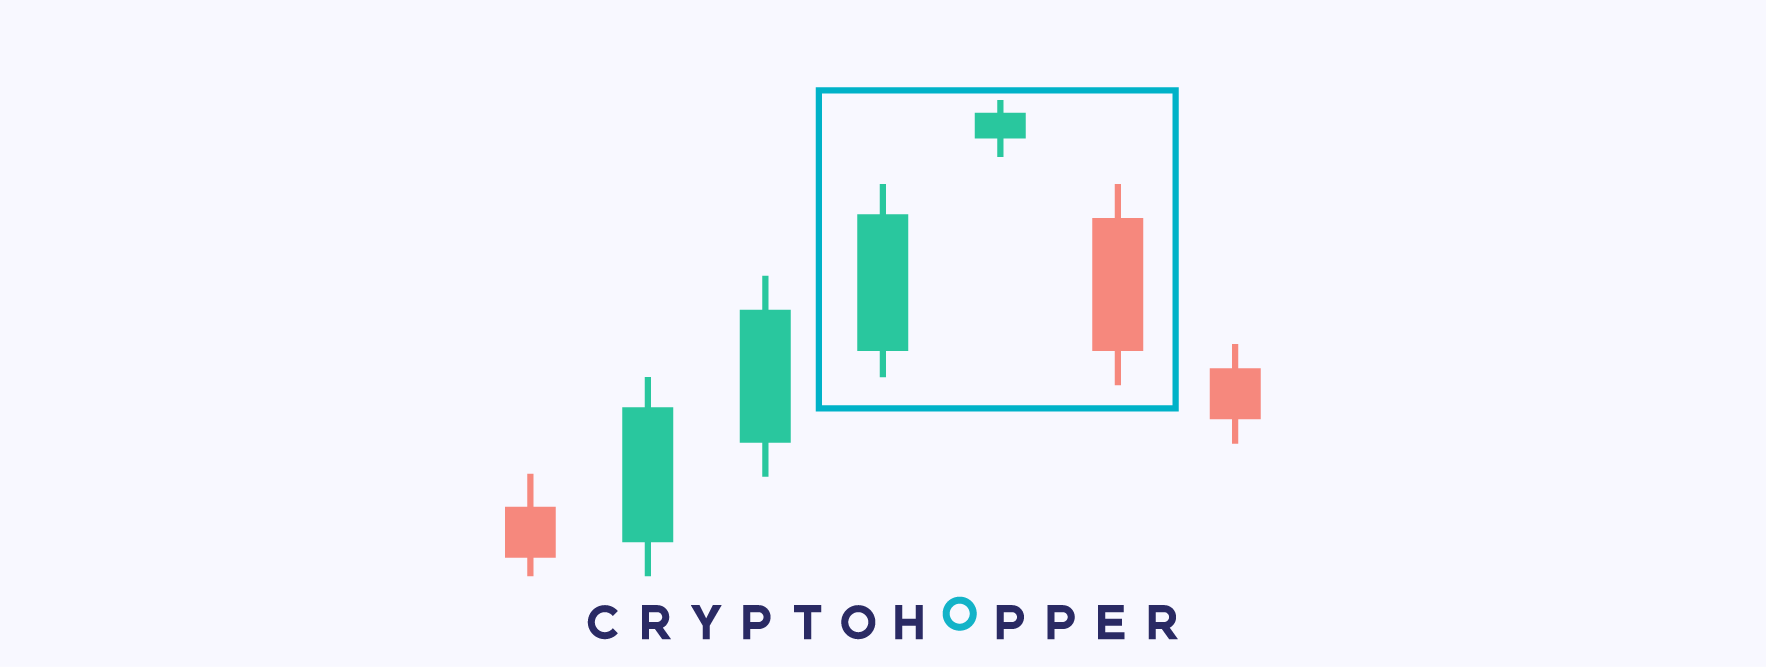 The Abandoned Baby Bearish is a bearish reversal pattern represented by three candles.
The first candle has a long body and upward movement. The middle one is a Doji, followed by a candle with a long body and a downward movement.
As suggested by the first increasing candle, the price is in an upward trend. The next one is a Doji, commonly known for its indecision component, usually appears at the end of bearish and bullish trends and initiate a new trend. Finally, with the last decreasing candle, the bears take over and kick off the trend reversal.
Normally, this pattern leads to a downward trend reversal. Therefore, if selected in your strategy, it will be interpreted as a bearish sign and generate a sell signal.
Abandoned Baby Bullish
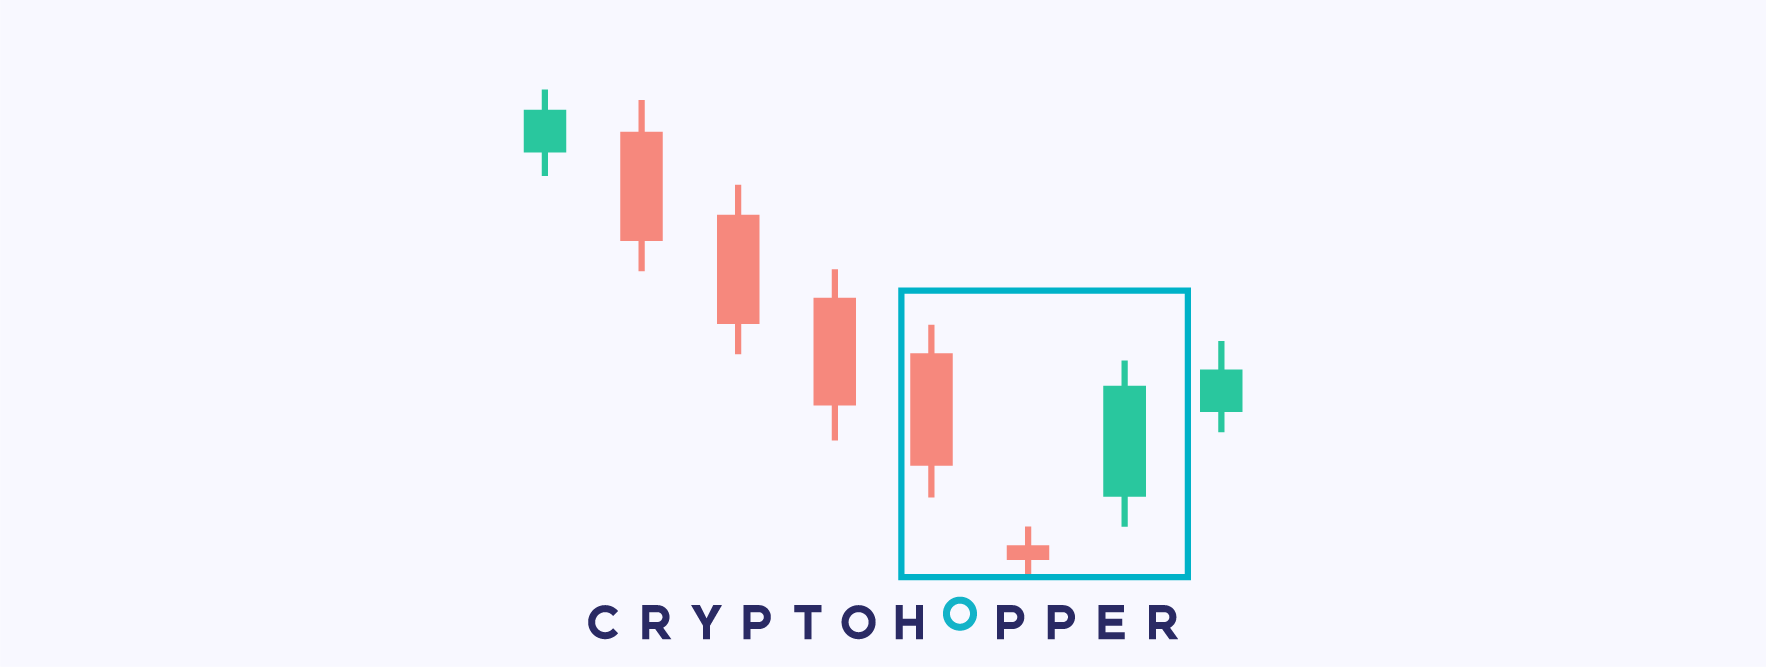 The Abandoned Baby Bullish is a bullish reversal pattern represented by three candles.
The first candle has a long body and downward movement. The middle one is a Doji, followed by a candle with a long body and a upward movement.
As suggested by the first decreasing candle, the price is in a downward trend. The next one is a Doji, commonly known for its indecision component, usually appears at the end of bearish and bullish trends and initiate a new trend. Finally, with the last increasing candle, the bulls take over and kick off the trend reversal.
Normally, this pattern leads to an upward trend reversal. Therefore, if selected in your strategy, it will be interpreted as a bullish sign and generate a buy signal.
Advance Block
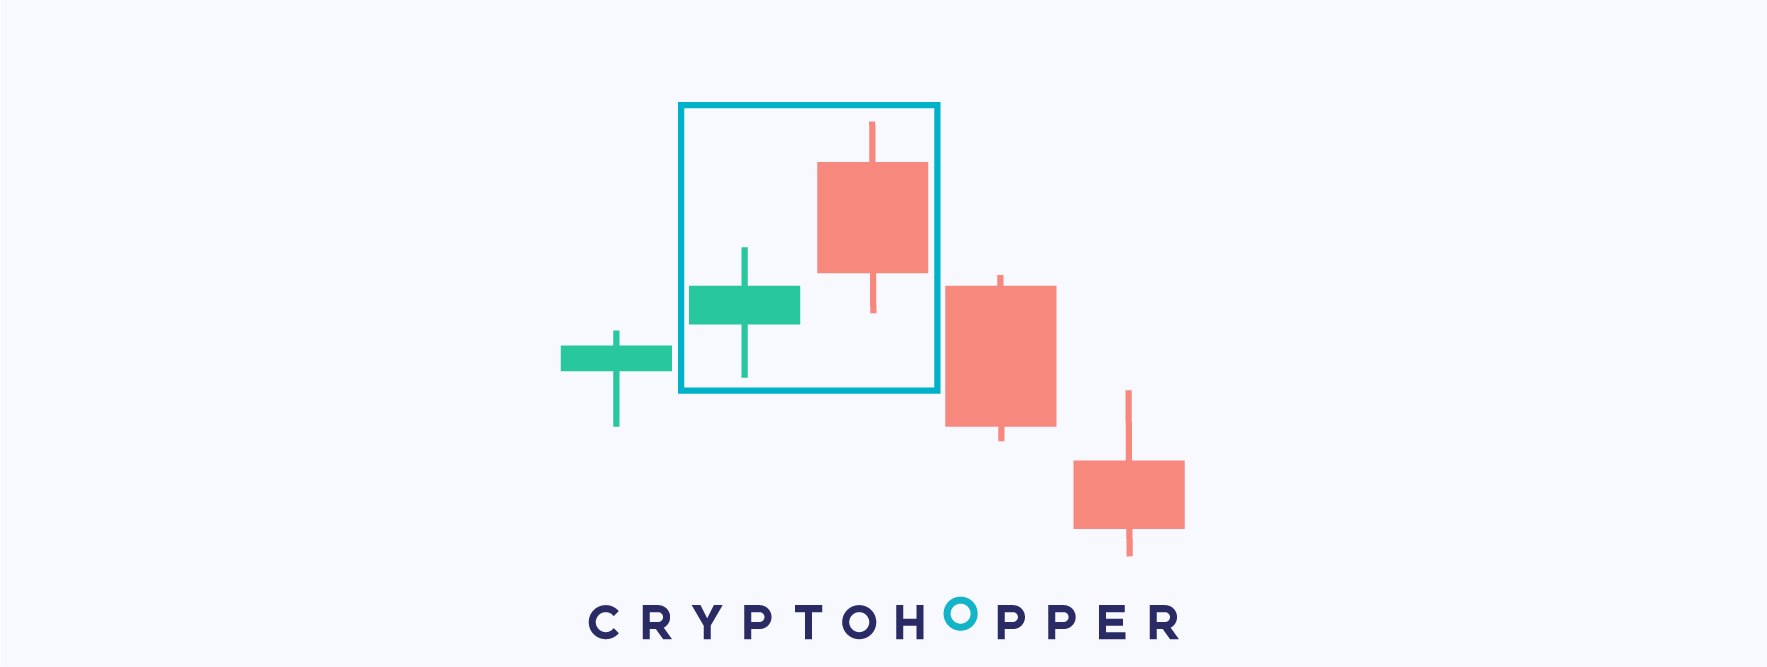
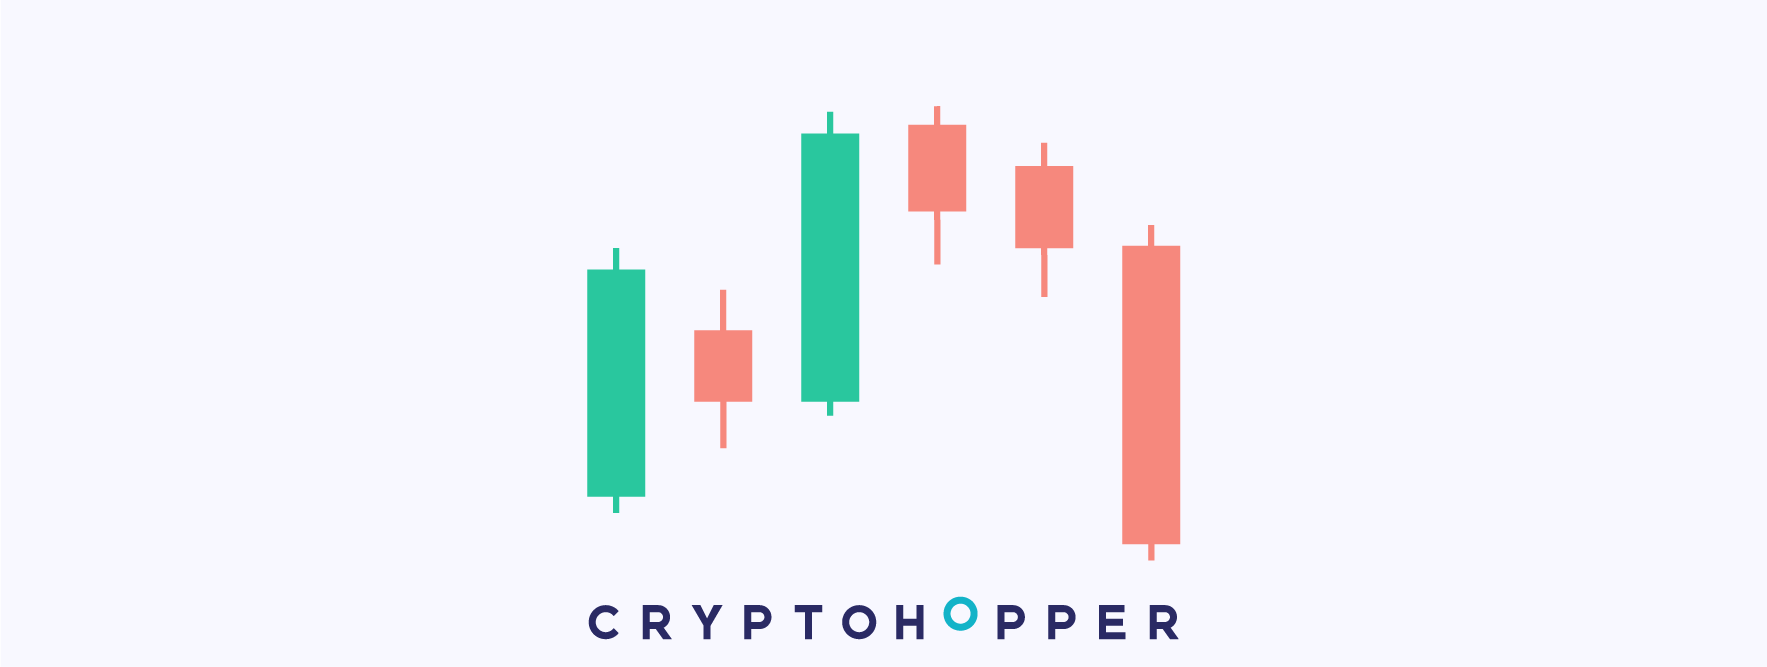
 The Advance Block is a bearish reversal pattern represented by three candles.
During an upward trend, the three candles have progressively shorter bodies, while the wick of the candle becomes progressively longer with every candle. The last candle has a short body and a long wick, having the shape of an Inverted Hammer.
The Advance Block represents how the bears slowly take over an upward trend to initiate new falls. Shorter bodies and longer upper wicks are a sign of a significant increase in the supply. A supply force that is stopping and pushing down the price.
This pattern appears when a positive trend is fading and very likely evolving into a new downward trend. Therefore, can be very practical to generate sell signals many trading strategies.
Bearish Doji Star
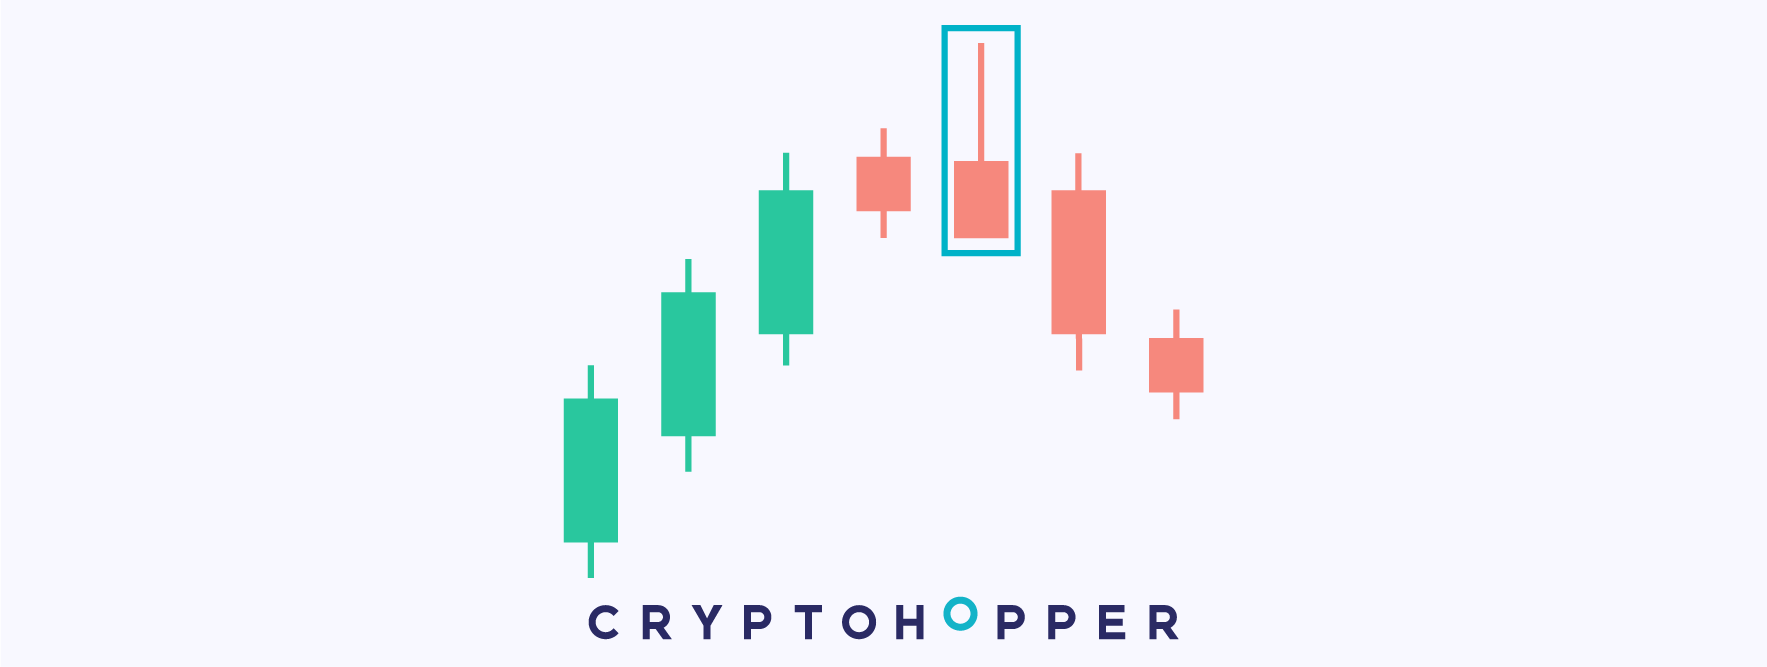
 The Bearish Doji Star is a bearish reversal pattern represented by two candles.
During an uptrend, the first candle is increasing and has a long body. It is followed by a Doji that opens and closes above the previous candle.
Dojis are indecision patterns and represent how bulls and bears fight to determine the future direction of the price.
This pattern represents how an uptrend fades out and leads to a bearish reversal. The Doji at the end of the uptrend reflects how the bears have suddenly appeared to stop the trend and, very likely, push the price down
Since this pattern usually precedes to falls in the price, it will signal a sell every time that it appears in the chart.
Belt-Hold Bearish
 The Belt-Hold Bearish is a bearish reversal pattern represented by one candle.
After an upward movement, this candle opens at the period's high and, afterward, closes near its low.
During an uptrend, this candle opens at its maximum and immediately starts falling to close near the low of the candle. The supply quickly rejects the price and drives it down, therefore, increasing the chances of fading the uptrend.
Due to the Belt-Hold Bearish pattern, generally, has more chances to anticipate bearish reversals, it will generate a sell signal if selected in your strategy. It can be easily combined with other indicators and candlestick patterns to filter out potential negative trades.
Belt-Hold Bullish
 The Belt-Hold Bullish is a bearish reversal pattern represented by one candle.
After a downtrend, this candle opens at the period's low and, afterward, closes near its high.
During a downtrend, this candle opens at its low and immediately starts increasing to close near the maximum of the candle. The demand quickly rejects the price and drives it up, therefore, increasing the chances of fading the downtrend.
Due to the Belt-Hold Bearish pattern, generally, has more chances to anticipate bullish reversals, it will generate a buy signal if selected in your strategy. It can be easily combined with other indicators and candlestick patterns to filter out potential negative trades.
Breakaway Bearish
 The Breakaway Bearish is a bearish reversal pattern represented by five candles.
The first four candles are increasing. The first one has a long body and is followed by three consecutive smaller candles. The last candle starts a downward movement and engulfs the previous three increasing candles.
This pattern represents a trend break. The first candle has a long increasing body, so the demand is still very present in the market. However, the next three candles are still increasing but have shorter bodies, which indicates that the trend's strength is reducing. Finally, the supply pushes heavily the price down with a long decreasing candle.
The last candle begins a new bearish trend. Therefore, this pattern anticipates price falls and would provide a sell signal.
Breakaway Bullish
 The Breakaway bullish is a bullish reversal pattern represented by five candles.
The first four candles are decreasing. The first one has a long body and is followed by three consecutive smaller candles. The last candle starts an upward movement and its size covers the previous three decreasing candles.
This pattern represents a trend break. The first candle has a long decreasing body, so the supply is still very present in the market. However, the next three candles are decreasing but have shorter bodies, which indicates that the trend's strength is reducing. Finally, the demand pushes heavily the price up with a long increasing candle.
Usually, the last candle begins a new bullish trend. Therefore, the Breakaway bullish anticipates price rises and would provide a buy signal if selected in the strategy.
Bullish Doji Star
 The Bullish Doji Star is a bullish reversal pattern represented by two candles.
During a downtrend, the first candle is decreasing and has a long body. It is followed by a Doji that opens and closes below the previous candle.
Dojis are indecision patterns and represent how bulls and bears fight to determine the future direction of the price.
This pattern represents how a downtrend fades out and leads to a bullish reversal. The Doji at the end of the downtrend reflects how the bulls have suddenly appeared to stop the trend and, very likely, push the price up
Since this pattern usually precedes to rises in the price, it will signal a buy every time that it appears in the chart.
Closing Marubozu Bearish
 The Closing Marubozu Bearish is a bearish pattern represented by one candle.
It is a long decreasing candle, with no lower wick and short, or none, upper wick.
It takes place when there is a peak in the supply that drives the price down with a long decreasing candle. This pattern is especially common in the cryptocurrency markets due to its high volatility.
The Marubozu is rather a continuation pattern. Therefore, whenever it appears in a chart, it implies that the price is likely to continue decreasing and can be interpreted as a sell signal. This sell pattern can be easily combined with other indicators and patterns to reinforce the strategy.
Closing Marubozu Bullish
 The Closing Marubozu Bullish is a bullish pattern represented by one candle.
It is a long increasing candle, with no upper wick and short, or none, lower wick.
It takes place when there is a peak in the demand that drives the price up with a long increasing candle. This pattern is especially common in the cryptocurrency markets due to its high volatility.
The Marubozu is rather a continuation pattern. Therefore, whenever it appears in a chart, it implies that the price is likely to continue increasing and can be interpreted as a buy signal. It can be easily combined with other indicators and patterns to reinforce the strategy.
Concealing Baby Swallow
 The Concealing Baby Swallow is a bullish reversal pattern represented by four candles.
The first two are bearish Marubozus, which are candles with a long body and short wicks. The third candle increases and eats into the body of the previous one, to close near the prior low. The last candle totally engulfs the third one and closes above its maximum.
The theory behind this pattern is that during a downtrend, the bulls respond quickly to two very bearish candles. After the first two decreasing candles, the demand rejects further falls and responds with a large bullish candle that, likely, could initiate a new uptrend.
Due to this pattern usually leads to bullish trend reversals, it can be added to a trading strategy as a buy trigger. Once the system spots it, it will give a buy signal.
Counterattack Bearish
 The Counterattack Bearish is a bearish reversal pattern represented by two candles.
During an upward trend, a first increasing candle with a long body and short wick, is followed by a second candle heading downwards and closing near the first candle's close.
As the name suggests, the pattern represents a bearish counterattack. During an uptrend, a red candle with a medium-long body forms and closes at the same level as the previous candle.
The long red candle means that the bears have strongly rejected the uptrend, probably due to the price has reached a resistance and the price can go down. This pattern is likely to lead to a new downtrend or a retracement. Therefore, if selected in your strategy, it would sell a position or open a short.
Counterattack Bullish
 The Counterattack Bullish is a bullish reversal pattern represented by two candles.
During a downward trend, a first decreasing candle with a long body and short wick, is followed by a second candle heading upwards and closing near the first candle's close.
As the name suggests, the pattern represents a bullish counterattack. During a downtrend, a green candle with medium-long body forms and closes at the same level as the previous candle.
The long green candle means that the bulls have strongly rejected the downtrend, probably due to the price has reached a support and the price can go up. This pattern is likely to lead to a new uptrend or a pull-back. Therefore, if selected in your strategy, it would open a position.
Dark Cloud Cover
 The Dark Cloud Cover is a bearish reversal pattern represented by one candle.
This candle makes a new high but closes below the middle point of the previous candle, then initiating a potential downward movement.
After a Dark Cloud Cover appears in a chart, the price is likely to initiate a new bearish trend or perform a pull-back within the uptrend. If selected in your strategy, this one-candle pattern will signal a sell.
Since this pattern is compounded by one candle, many traders would combine this pattern with an indicator to have more confirmation when it comes to open a position.
Down-Gap Side-By-Side White Lines Bearish
 The Down-Gap Side-By-Side White Lines Bearish is a bearish continuation pattern represented by three candles.
During a downtrend, the first candle decreases. The second candle opens below the close of the previous candle, then making a gap. The third candle is similar to the previous one, but its maximum is lower.
The bearish pressure has been so big, that the price has created a Down-Gap. The next two candles keep decreasing, which tells us that the price hasn't finished the bearish trend yet.
Generally, this pattern precedes a fall in the price. Therefore, it will generate a sell signal.
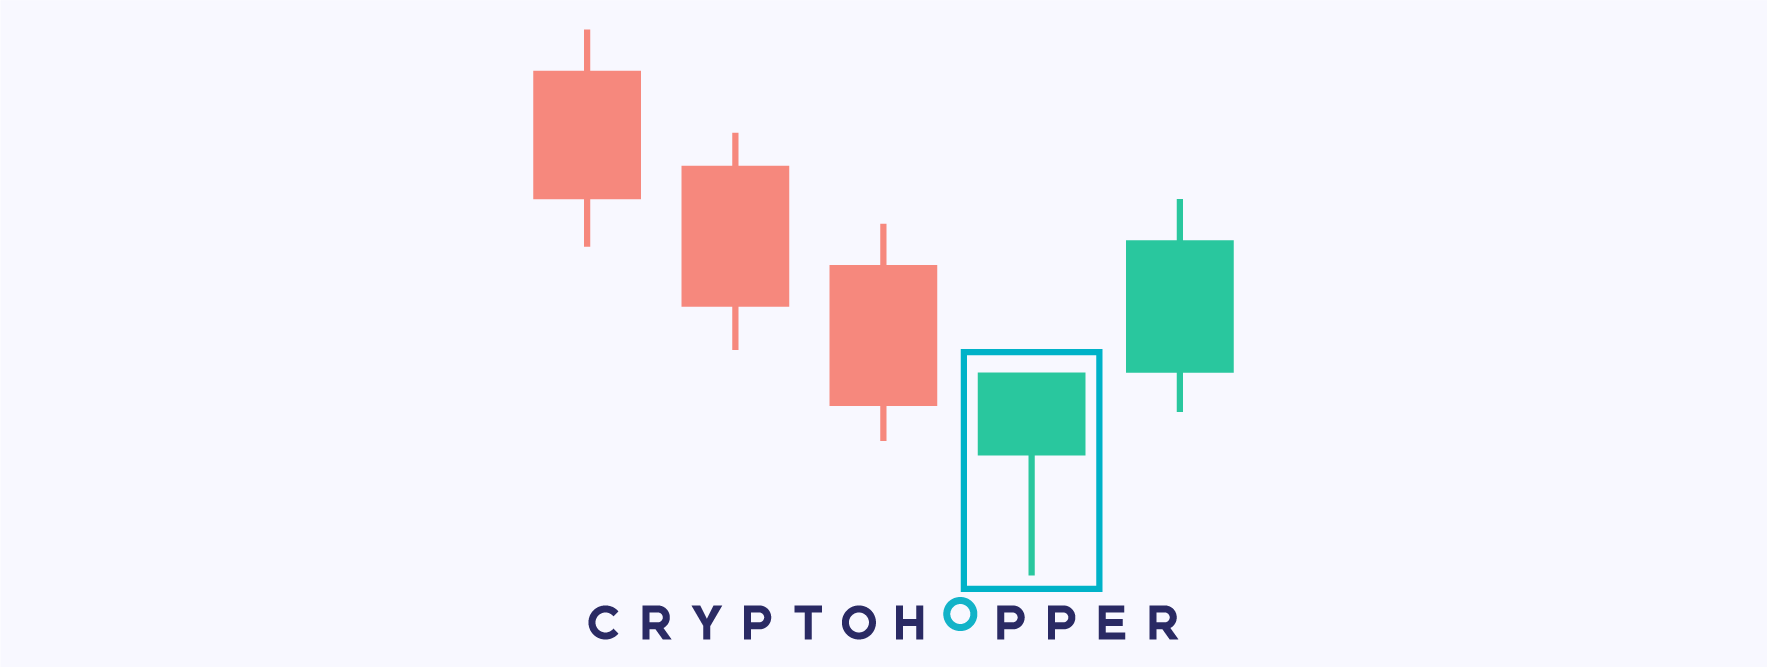
Downside Gap Three Methods Bullish
 The Downside Gap Three Methods Bullish is a bullish reversal pattern represented by three candles.
During a downtrend, the first candle decreases and has a long body. The second candle, still decreasing, opens below the low of the previous one, then featuring a gap. The third one starts increasing and closes within the body of the first candle.
During a downtrend, two long decreasing candles feature a gap between them. Gaps usually tend to be closed by another candle, and we can see how the third candle closes it with a long bullish movement. The bulls take over the third and last candle, making a long increasing candle that closes above the previous one, and very likely initiates a new uptrend.
Therefore, this pattern would signal a buy in your strategy.
Downside Tasuki Gap
 The Downside Tasuki Gap is a bearish continuation pattern represented by three candles.
During a downtrend, the first candle is decreasing and is followed by another red candle that has made a gap between both candles. The third candle is increasing and closes within the previous gap.
At some point, the bearish pressure is so big, probably due to traders are selling off their positions, that the price makes a gap between two candles. After the first two decreasing candles that made the gap, the price is relatively cheap, which makes traders take long positions and push the price up.
The third candle of the pattern increases and is likely to push the price higher or even initiate a new uptrend. Then, this pattern would signal a buy in your strategy.
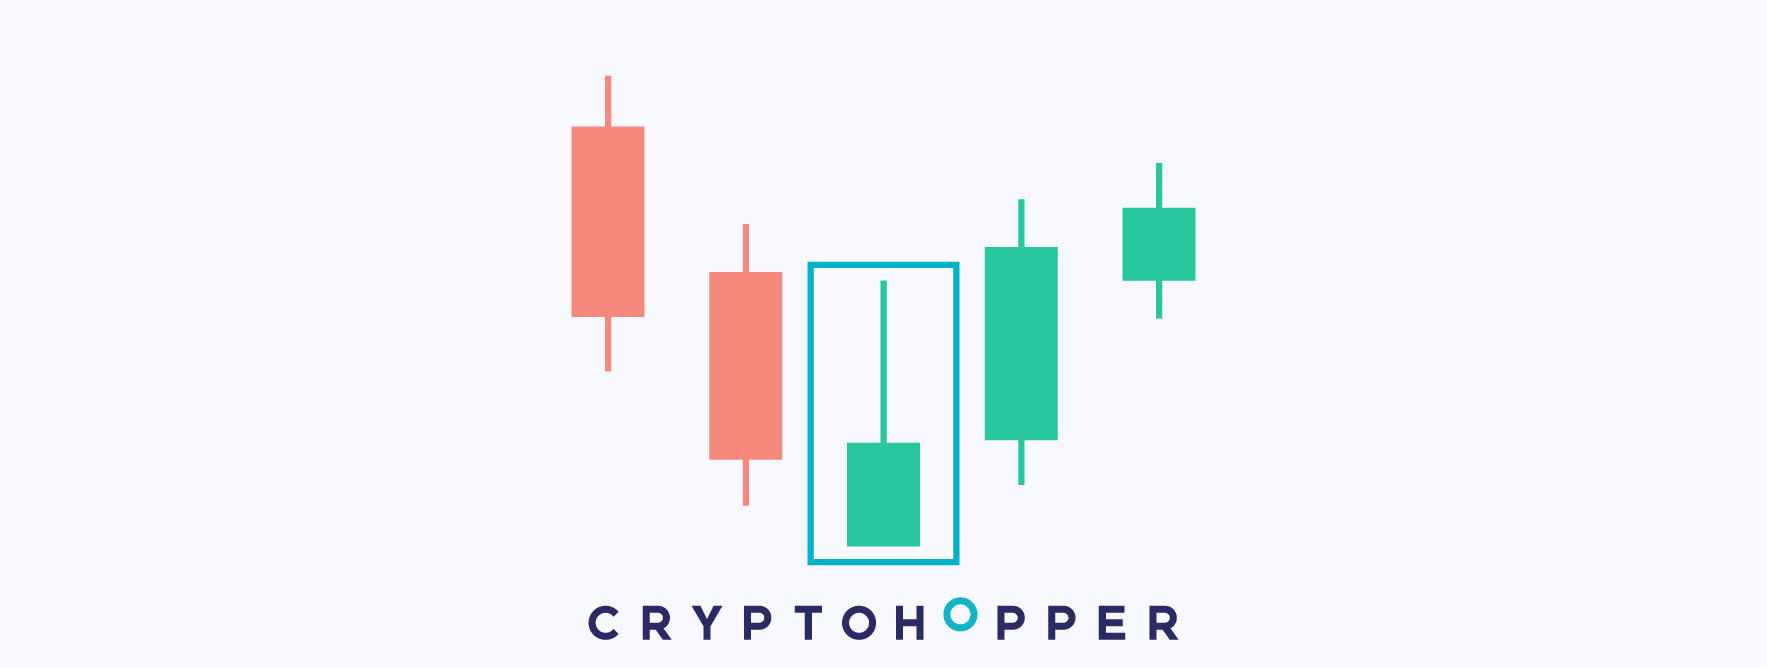
Dragonfly Doji
 Dragonfly Doji is a bearish reversal pattern represented by one candle.
This candle has the shape of a Doji with a long lower wick and no upper wick.
This one-candle pattern can have bearish potential, especially if found during uptrends. Dojis are indecision patterns per se. Bulls and bears fight none of them wins and the open and close of the candle are very close to each other. However, when it is following an uptrend it's more likely that the bears will take over and the price will decline.
Dragonfly Dojis will signal a sell in an automated strategy when it is spotted in the chart.
Engulfing Bearish
 The Engulfing Bearish is a bearish reversal pattern represented by two candles.
The second candle totally engulfs the first one and starts a downward movement.
During an uptrend or upward movement, the first candle is still increasing, however, the bears respond aggressively creating a red candle that engulfs the previous one. Represented by a long decreasing candle, the sellers take over the market and push the price down.
This pattern usually precedes to lower prices due to the higher pressure of the supply on the price. Therefore, it will signal a sell if selected in your automated strategy.
Engulfing Bullish
 The Engulfing Bullish is a bullish reversal pattern represented by two candles.
The second candle totally engulfs the first one and starts an upward movement.
During a downtrend or downward movement, the first candle is decreasing, however, the bulls respond aggressively creating a green candle that engulfs the previous one. Represented by a long increasing candle, the buyers take over the market and push the price up.
This pattern usually precedes higher prices due to the higher pressure of the supply on the price. Therefore, it will signal a buy if selected in your automated strategy.
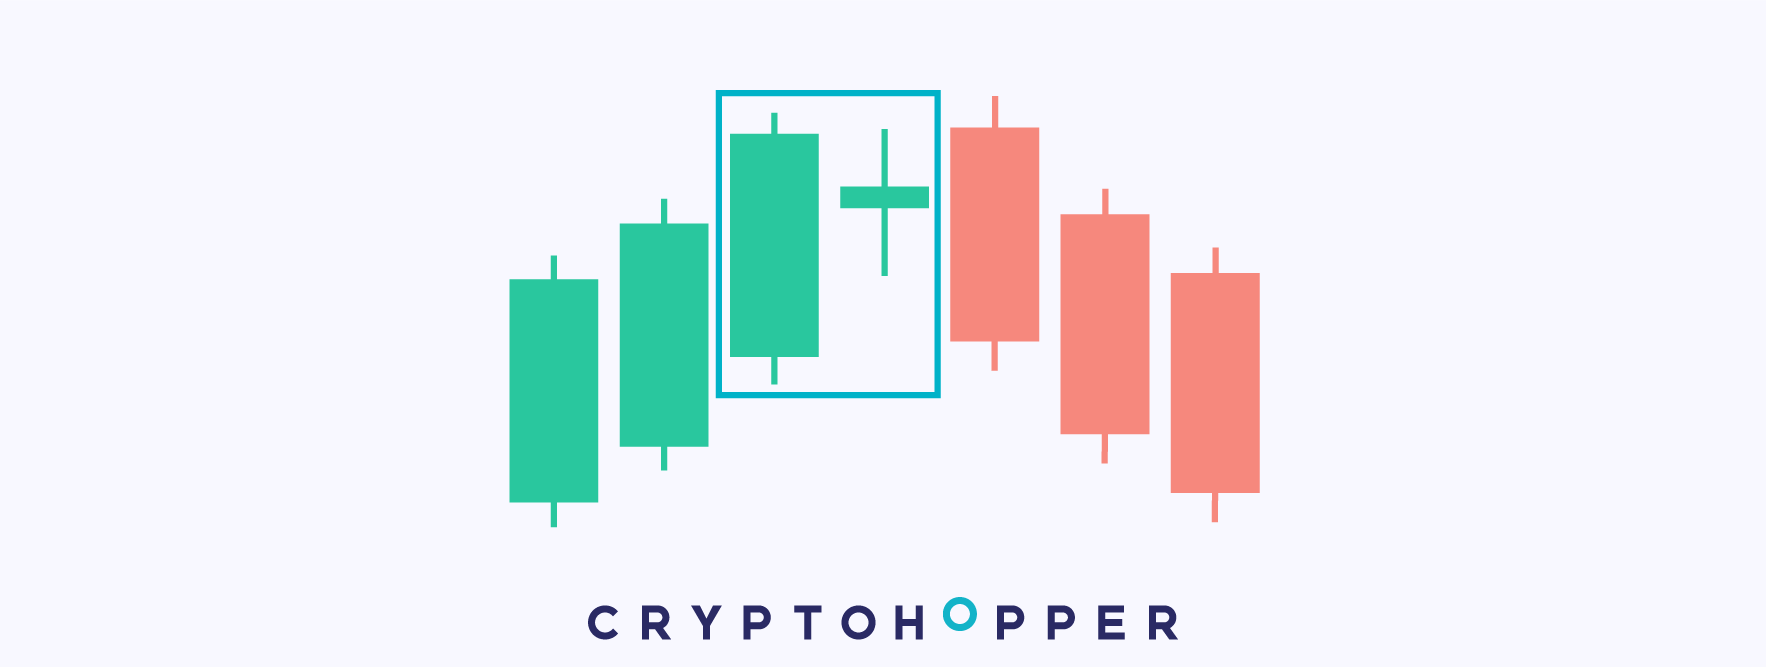
Evening Doji Star
 The Evening Doji Star is a bearish reversal pattern represented by three candles.
During an uptrend, a long increasing candle is followed by a Doji. The third candle decreases, has a long body and closes below the midpoint of the first candle.
It is a very used pattern in trading, especially used to anticipate bearish moves in the chart. It is usually found during upward moves. Afterward, an indecision candle, Doji, forms at the top of the pattern and is followed by a long decreasing candle that starts a bearish move.
The Evening Doji Star pattern represents how bears and bulls fight during an upward movement, which creates a Doji. Finally, the bears take over the market with a long red candle, therefore signaling a sell.
Evening Star
 The Evening Star is a bearish reversal pattern represented by three candles.
During an uptrend, a long increasing candle is followed by a green small-bodied candle. The third candle decreases, has a long body and closes below the midpoint of the first candle.
This pattern is similar to the Evening Doji Star and is commonly used to anticipate bearish movements. The Evening Star pattern represents how bears and bulls fight during an upward movement, which creates a small-bodied candle with long wicks. Finally, the bears take over the market with a long red candle, which initiates falls in the price
Commonly, this pattern leads to a bearish reversal, which can be used to close positions or open shorts. Therefore, if selected in your strategy, it will signal a sell.
Falling Three Methods
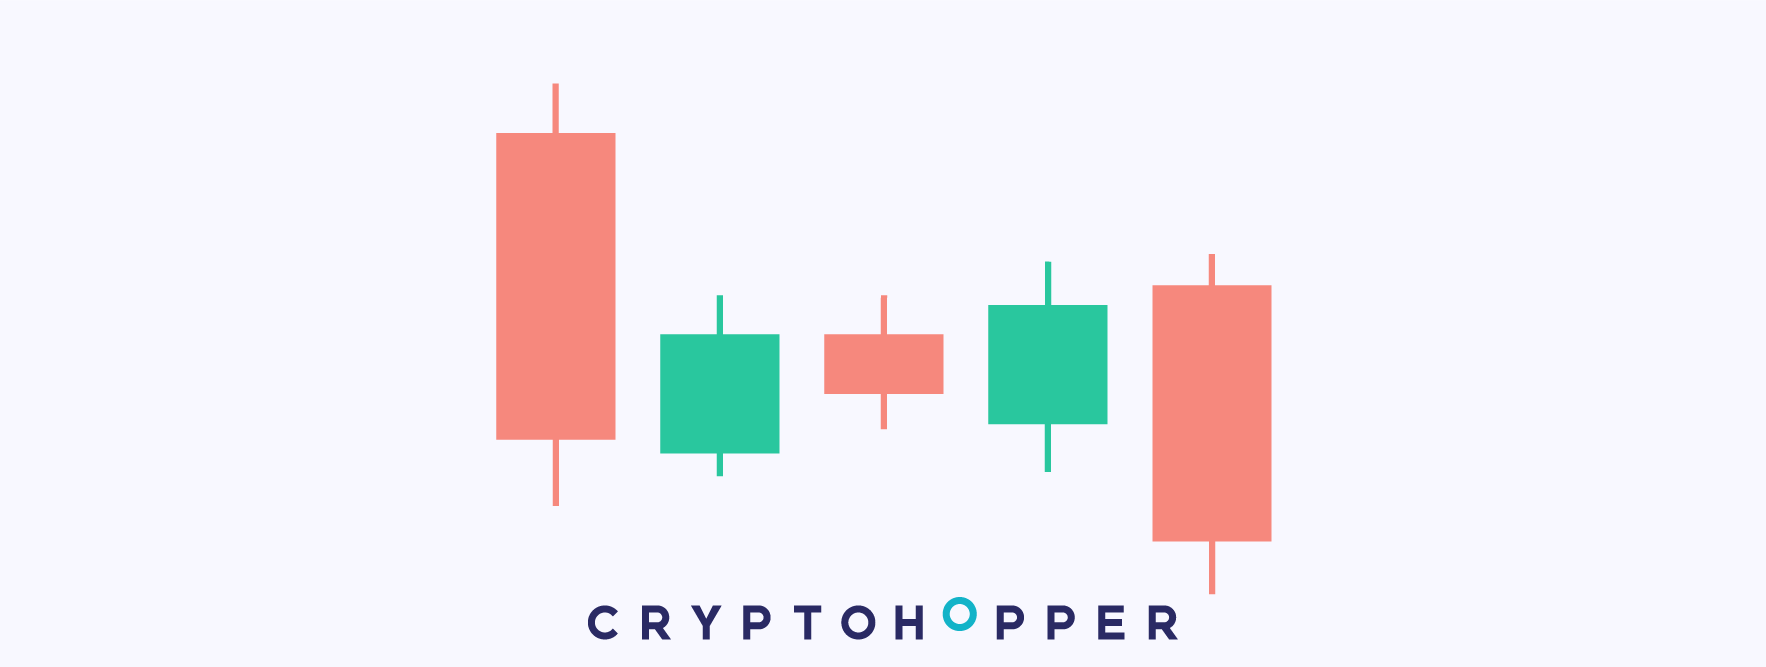 The Falling Three Methods is a continuation bearish pattern represented by five candles.
During a downtrend, a long decreasing candle forms and is followed by three increasing candles with small bodies. Finally, a decreasing candle with a long body covers the previous three candles and closes below the previous low of that range.
This pattern represents a pull-back. The first candle has a long body and decreases, which means that a lot of supply volume pushed the price down. Then the pull-back occurs. Three small-bodied candles increase to the level where the first candle opened.
Finally, since it is a continuation pattern, the last candle continues decreasing and usually leads to further falls in the price. Therefore, this pattern signals sells.
Gravestone Doji
 The Gravestone Doji is a bearish reversal pattern represented by one candle.
This candle has the low, open and closes around the same price, while the higher features a long upper wick.
As it was explained during other Doji patterns, Dojis are indecision patterns. Their shape determines whether they have higher chances to lead to rises or falls in the price.
On this occasion, the Doji has a long upper wick, which indicates that the bears are more present in the market and the price is more likely to go down.
Therefore, if selected in an automated strategy, this pattern will signal a sell when spotted in the chart.
Hammer
 A Hammer is a bullish reversal pattern formed by one candle.
It has a short body at the top and a long lower wick. That is, its opening, closing, and maximum are very close to each other. However, the minimum is relatively far from them.
Commonly found during downtrends, its long lower wick suggests that the demand has strongly rejected the price when it tried to continue its way downwards. Then, suggesting that the demand is very present at that price and that it can reverse its trend.
Usually, a Hammer precedes an upwards trend reversal or pullback. Therefore, whenever it appears in a chart, it implies that the price is likely to increase and can be interpreted as a buy signal. Also, it can be easily combined with other indicators to reinforce the entry points.
Hanging Man
 The Hanging Man is a one-candle bearish reversal pattern.
It is represented as a candle with a long lower wick and a short body at the top.
The name of this pattern comes from its shape. It is usually found during upward movements and often leads to falls in the price and is a sign of weakness of the trend.
Basing your trading on one-candle patterns can be rather risky. However, these suggest where the price is going to head. Finding a Hanging Man during an uptrend can show how a trend is fading out and can reverse. Therefore, this pattern would signal a sell in a strategy.
Harami Bearish
 The Harami Bearish is a bearish reversal pattern represented by two candles.
The first candle increases and has a long body, it's followed by a small decreasing candle within the range of the previous one.
The first candle is long and barely has wicks. However, the second candle creates a small gap and stars decreasing, which means that the uptrend is not as strong as before.
This pattern usually shows signs of weakness in an ongoing uptrend, which probably leads to a bearish movement right after the pattern or after some periods. Therefore, this pattern would signal a sell when appears in a chart.
Harami Bullish
 The Harami Bullish is a bullish reversal pattern represented by two candles.
The first candle is a decreasing candle with a long body, it's followed by a small increasing candle within the range of the previous one.
The first candle is long and barely has wicks. However, the second candle creates a small gap and stars increasing, which means that the downtrend is not as strong as before.
This pattern usually shows signs of weakness in an ongoing downtrend, which probably will lead to a bullish movement right after the pattern or after some periods. Therefore, this pattern would signal a buy whenever it appears in a chart.
Harami Cross Bearish
 The Harami Cross Bearish is a bearish reversal pattern represented by two candles.
During an uptrend, the first candle keeps increasing and has a long body. The second candle is a Doji.
The difference between this pattern and the Harami Bearish is the second candle. Instead of being a small-bodied candle, now it is a Doji.
The pattern's first candle is long and barely has wicks. However, the Doji creates a small gap, which means that the uptrend is not as strong as before.
As the Harami Bearish, it shows signs of weakness in an ongoing uptrend, which probably will lead to a bearish movement right after the pattern or after some periods. Therefore, this pattern would signal a sell when appears in a chart.
Harami Cross Bullish
 The Harami Cross Bullish is a bullish reversal pattern represented by two candles.
During a downtrend, the first candle keeps decreasing and has a long body. The second candle is a Doji.
The difference between this pattern and the Harami Bullish is the second candle. Instead of being a small-bodied candle, now it is a Doji.
The pattern's first candle is long and barely has wicks. However, the Doji creates a small gap, which means that the downtrend is not as strong as before.
As the Harami Bullish, it shows signs of weakness in an ongoing downtrend, which probably will lead to a bullish movement right after the pattern or after some periods. Therefore, this pattern would signal a buy when appears in a chart.
High-Wave Bearish
 The High-Wave Bearish is a bearish pattern represented by one candle.
It has a small body, long wicks and its close is below its opening, so it slightly decreases.
This one-candle pattern represents indecision in the market but with higher probabilities to go down since the bears won the fight and the candle closed below its opening price.
The High-Wave Bearish usually leads to bearish reversals or continuations of the price. Therefore, if selected in your strategy, it would signal sells when it's spotted in the chart.
Basing a strategy only on one candle patterns can be risky. However, you can easily select other indicators to get stronger sell points.
High-Wave Bullish
 The High-Wave Bullish is a bullish pattern represented by one candle.
It has a small body, long wicks and its close is above its opening, so it slightly increases.
This one-candle pattern represents indecision in the market but with higher probabilities to go up since the bulls won the fight and the candle closed above its opening price.
The High-Wave Bullish usually leads to bullish reversals or continuations of the price. Therefore, if selected in your strategy, it would signal buys when it's spotted in the chart.
Basing a strategy only on one candle patterns can be risky. However, you can easily select other indicators to get stronger buy points.
Hikkake Bearish
 The Hikkake Bearish is a bearish pattern represented by at least three candles.
The first candle has a long green body. The second candle is totally engulfed by the previous one. Finally, the third candle slightly breaks the minimum of the first candle.
The first candle is still increasing, probably coming from an uptrend. The second candle suggests the price might reverse since it decreases a bit. However, the third candle breaks the minimum of the pattern and very likely initiates a downtrend.
This pattern has very strong bearish components. When it is spotted in a chart, the likelihood of the price heading downwards increases, therefore, this pattern is used to sell a position or open a short.
Hikkake Bullish
 The Hikkake Bullish is a bullish pattern represented by at least three candles.
The first candle has a long red body. The second candle is totally engulfed by the previous one. Finally, the third candle slightly breaks the maximum of the first candle.
The first candle is still decreasing, probably coming from a downtrend. The second candle suggests the price might reverse since it increases a bit. However, the third candle breaks the maximum of the pattern and very likely initiates an uptrend.
This pattern has very strong bullish components. When it is spotted in a chart, the likelihood of the price heading upwards increases, therefore, this pattern is used to open a long position.
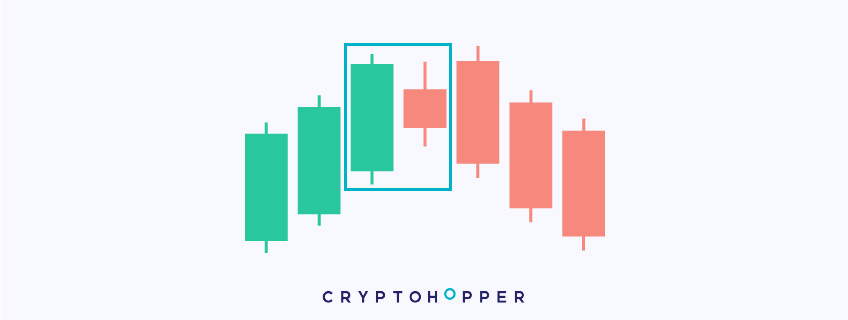
Homing Pigeon Bearish
 The Homing Pigeon Bearish is a bearish pattern represented by two candles.
During an uptrend, the first candle is increasing and has a long body. It is followed by a smaller green candle but located within the range of the first one.
This pattern represents that the second candle is not making new highs in the current trend, hence, it is fading and might reverse.
Since this pattern usually leads to bearish trend reversals or pull-backs, it would signal a sell or open a short in your strategy.
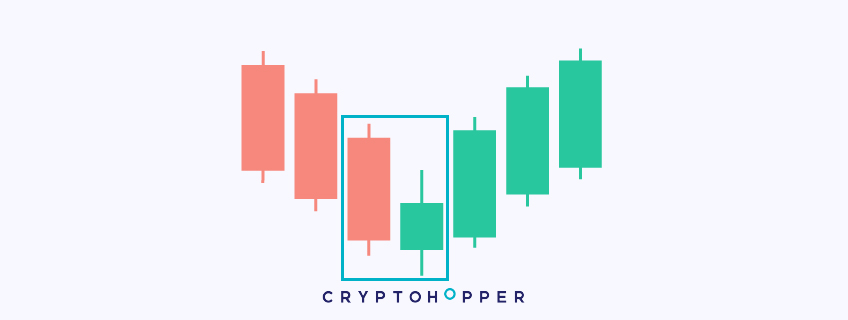
Homing Pigeon Bullish
 The Homing Pigeon Bullish is a bullish pattern represented by two candles.
During a downtrend, the first candle is decreasing and has a long body. It is followed by a smaller red candle but located within the range of the first one.
This pattern represents that the second candle is not making new lows in the current trend, hence, it is fading and might reverse.
Since this pattern usually leads to bullish trend reversals or pull-backs, it would signal a buy in your strategy.
In-Neck
 The In-Neck is a bearish continuation pattern represented by two candles.
During a downtrend, a long decreasing candle is followed by a small increasing candle that opens below the previous candle and closes slightly above the previous close.
The bears are taking over the market and this pattern suggests that they are going to keep doing it. A first red candle drives the price south, and the second one, even though it is increasing, closes near the first candle's close. This means that the green candle is not solid enough to stop the downtrend.
Normally, this pattern forecasts falls in the price, therefore, it signals a sell.
Inverted Hammer
 The Inverted Hammer is a bearish reversal pattern represented by one candle.
It appears during an upward trend and as a candle with a long upper wick and a short body at the bottom.
Commonly found during uptrends, its long upper wick suggests that the demand has strongly rejected the price when it tried to continue its way upwards. Then, indicating that the supply is very present at that price and that it can reverse its trend.
Usually, an Inverted Hammer precedes a downwards trend reversal or pullback. Therefore, it implies that the price is likely to decrease and can be interpreted as a sell signal. Also, it can be easily combined with other indicators to reinforce the entry points.
Kicking Bearish
 The Kicking Bearish is a bearish pattern represented by two candles.
During an uptrend, a long increasing candle forms, which is followed by another long decreasing candle. This second candle opens with a small gap in between both.
As explained in other patterns, a long candle is commonly denominated as a Marubazu. This bearish pattern is formed by two Marubazus. One that is continuing with the upward trend, and the next one causes a gap and lowers the price significantly.
When spotted in a chart, it is a strong sign that suggests that the market is going down. The second candle proves that the bears are in control, which signals a sell in your strategy.
Kicking Bullish
 The Kicking Bullish is a bullish pattern represented by two candles.
During a downtrend, a long decreasing candle forms, which is followed by another long increasing candle. This second candle opens with a small gap in between both.
As explained in other patterns, a long candle is commonly denominated as a Marubazu. This bullish pattern is formed by two Marubazus. One that is continuing with the downward trend, and the next one causes a gap and pushes the price up significantly.
When spotted in a chart, it is a strong sign that suggests that the market is going up. The second candle proves that the bulls are in control, which signals a buy in your strategy.
Ladder Bottom
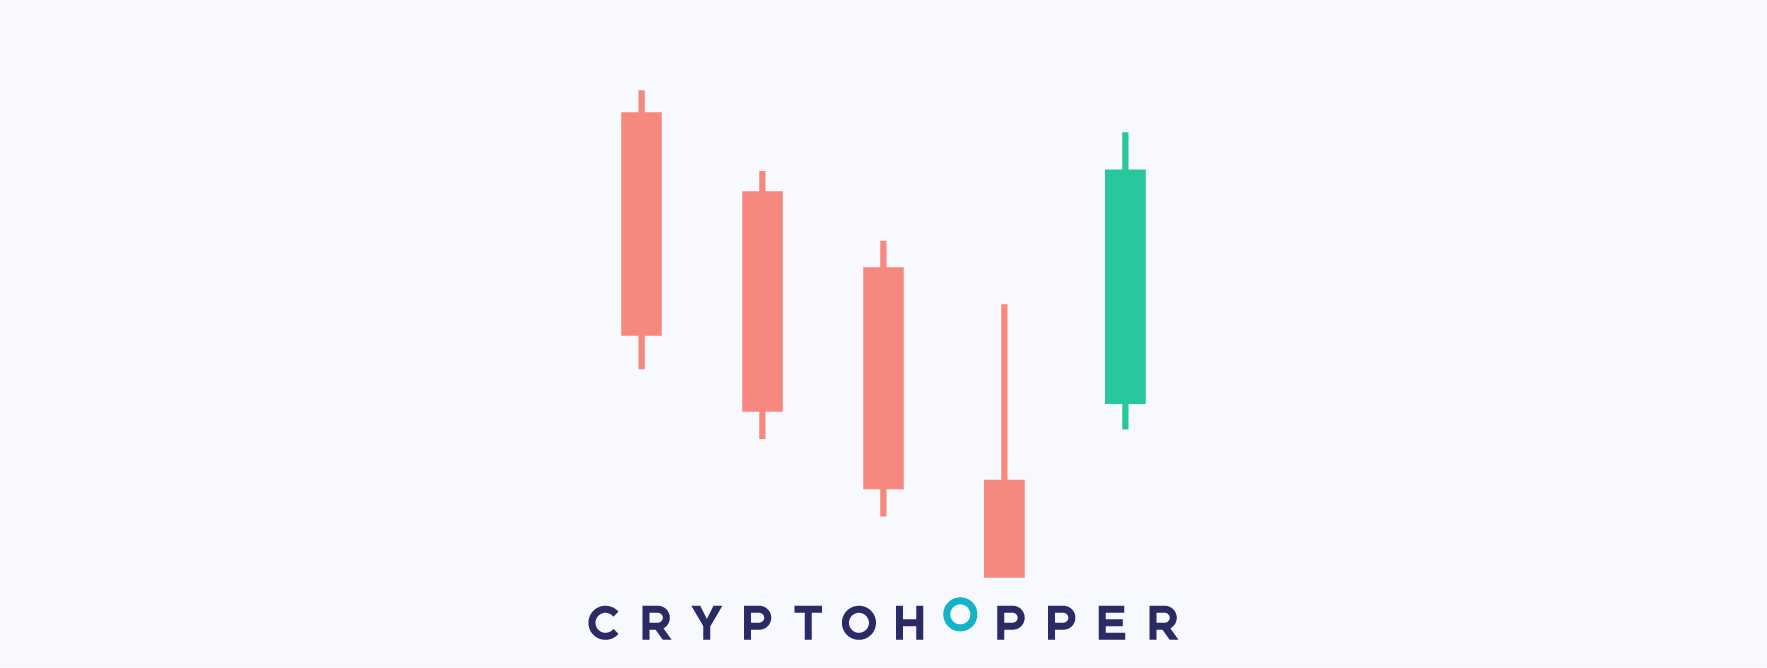 The Ladder Bottom is a bullish reversal pattern represented by five candles.
During a downtrend, the first three candles have a long decreasing body. The fourth candle also decreases and has the shape of an Inverted Hammer. Finally, the last candle is a long increasing candle that opens above the previous close.
The first three decreasing candles continue with the ongoing downtrend, but the fourth one shows signs of weakness. Finally, the last one is a long increasing candle that kicks off the beginning of a new trend.
The fifth candle ends with the downtrend and initiates a bullish movement that is likely to continue, therefore, it signals a buy.
Ladder Top
 The Ladder Top is a bearish reversal pattern represented by five candles.
During an uptrend, the first three candles have a long increasing body. The fourth candle also increases and has the shape of a Hammer. Finally, the last candle is a long decreasing candle that opens below the previous close.
The first three increasing candles continue with the ongoing uptrend, but the fourth one shows signs of weakness. Finally, the last one is a long decreasing candle that kicks off the beginning of a new trend.
The fifth candle ends with the uptrend and initiates a bearish movement that is likely to continue, therefore, it signals a sell.
Long Line Bearish
 The Long Line Bearish is a bearish continuation pattern represented by one candle.
It is very similar to a Marabozu, that is, a long candle with a big body moving, in this case, down. Which indicates a strong bearish pressure in the market.
As the name suggests, it is a long candle with a downward direction. During a downtrend, the bearish pressure intensifies and pushes the price farther down.
With this pattern, the bears are dominating the market, which will signal a sell in your automated strategy.
Long Line Bullish
 The Long Line Bullish is a bullish continuation pattern represented by one candle.
It is very similar to a Marabozu, that is, a long candle with a big body moving up. Which indicates a strong bullish pressure in the market.
As the name suggests, it is a long candle with an upward direction. During an uptrend, the bullish pressure intensifies and pushes the price farther up.
With this pattern, the bulls are dominating the market, which will signal a buy in your automated strategy.
Marubozu Bearish
 The Marubozu Bearish is a bearish pattern represented by one candle.
It has a long body and short, or none, wicks with a downward movement.
The Marubozu has no wicks or shades, it is a long candle that heads to one direction very aggressively.
It can be bearish or bullish. In this case, it is bearish, therefore the bears are taking over the market and driving the price down. By selecting this indicator in your trading strategy, this pattern will generate a sell signal.
Marubozu Bullish
 Marubozu Bullish is a bullish pattern represented by one candle.
It has a long body and short, or none, wicks with an upward movement.
The Marubozu has no wicks or shades, it is a long candle that heads to one direction very aggressively.
It can be bearish or bullish. In this case, it is bullish, therefore the bulls are taking over the market and driving the price up. By selecting this indicator in your trading strategy, this pattern will generate a buy signal.
Mat Hold Bearish
 The Mat Hold Bearish is a bearish continuation pattern represented by five candles.
During a downtrend, the first candle is a long decreasing candle, followed by three increasing candles with small bodies. Finally, the fifth candle has a long decreasing body and will set a new low for this range.
This continuation pattern performs a pull-back or flag during the first four candles, and then continues decreasing. The first and last candle decrease, while the three in the middle represent the pull-back.
This pattern can be found during bearish trends and suggests that the price is very likely to continue its way down. When the hopper spots it in the chart, it will generate a sell signal.
Mat Hold Bullish
 The Mat Hold Bullish is a bullish continuation pattern represented by five candles.
During an uptrend, the first candle is a long increasing candle, followed by three decreasing candles with small bodies. Finally, the fifth candle has a long increasing body and will set a new high for this range.
This continuation pattern performs a pull-back or flag during the first four candles, and then continues increasing. The first and last candle increase, while the three in the middle represent the pull-back.
This pattern suggests that the price is very likely to continue its way up. When the hopper spots it in the chart, it will generate a buy signal.
Matching Low
 The Matching Low is a bullish reversal pattern represented by two candles.
During a downtrend, the first candle is a long decreasing candle. The second one also decreases, has a smaller body and closes at the same level as the previous candle, therefore, generating a resistance.
Due to the second candle's body is smaller and cannot break the low of the previous candle, the price generates a resistance and it loses bearish momentum.
This tells us that the downtrend might be over and the trend could reverse. Therefore, this pattern would signal a buy in the underlying cryptocurrency.
Modified Hikkake Bearish
 The Modified Hikkake Bearish is a continuation bearish pattern represented by three candles.
The first candle decreases and has a long body. The next one closes above the previous low and has a lower high. Finally, the third one decreases, has a long body and makes a new low.
The second candle increases and looks like it can make a reversal, it is often called the trap. However, it can't break the previous high and is totally engulfed by the first one.
The last candle decreases again and makes a new low, which leads the way for further falls. Then, this pattern will generate a sell signal.
Modified Hikkake Bullish
 The Modified Hikkake Bullish is a continuation bullish pattern represented by three candles.
The first candle increases and has a long body. The next one closes above the previous low and has a lower high. Finally, the third one increases, has a long body and makes a new high.
The second candle decreases and looks like it can make a reversal, it is often called the trap. However, it can't break the previous low and is totally engulfed by the first one.
The last candle increases again and makes a new high, which leads the way for further rises. Then, this pattern will generate a buy signal.
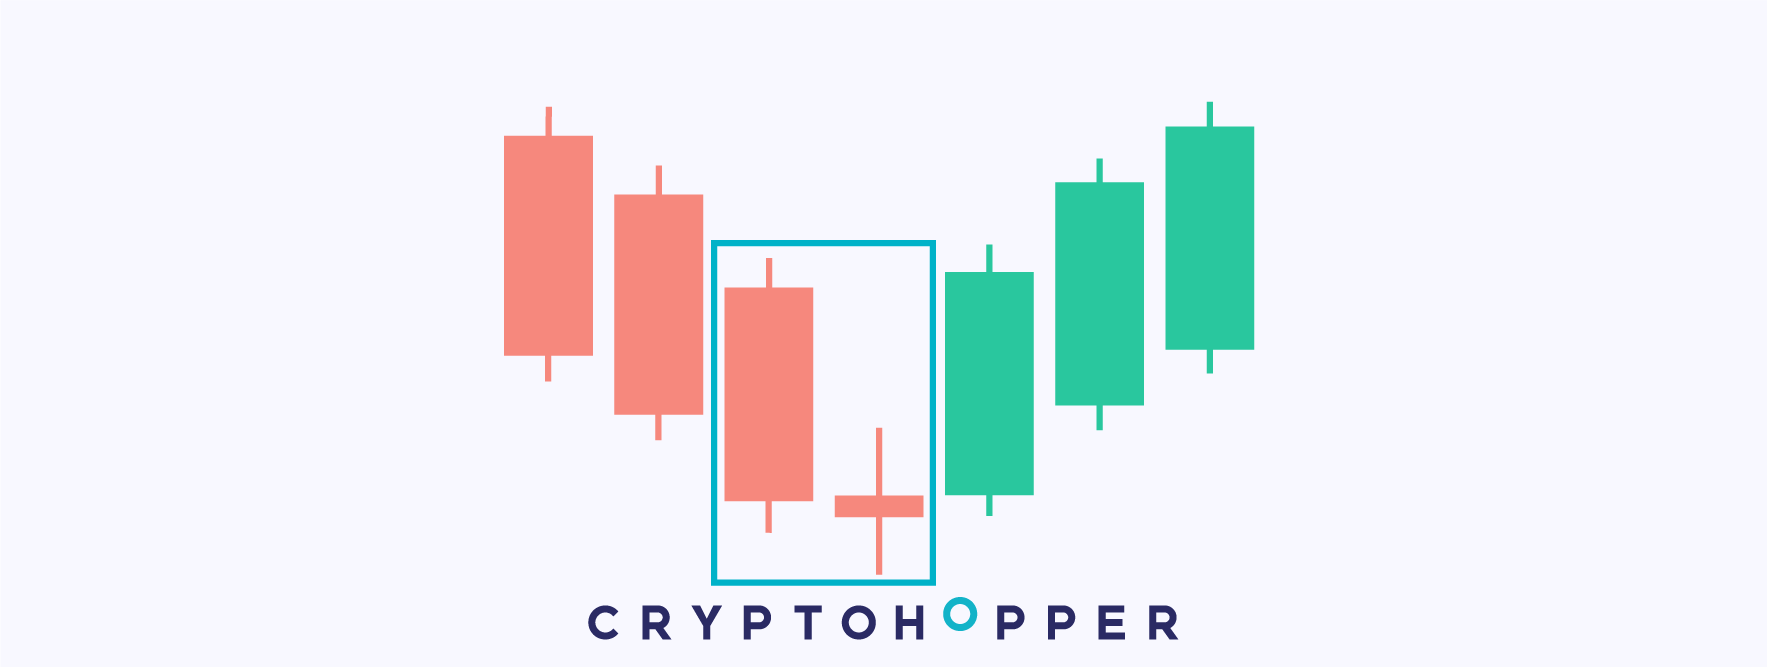
Morning Doji Star
 The Morning Doji Star is a bullish reversal pattern represented by three candles.
During a downtrend, the first candle is a long decreasing candle, followed by a Doji closing below the previous low. The third candle is a long increasing candle closing above the midpoint of the first candle.
During a downtrend, the indecision pattern, Doji, appears. This means that the current trend is losing strength, and the next candle confirms it. The third one initiates a bullish movement that could reverse the price direction.
Usually, this candlestick pattern leads to a bullish reversal of the price, then it will signal a buy in your strategy.
Morning Star
 The Morning Star is a bullish reversal pattern represented by three candles.
During a downtrend, the first candle is long and decreases. The second one is the so-called "star", which has a small body and closes below the previous low. The third candle is a long increasing candle closing above the midpoint of the first candle.
After several decreasing candles, a small green candle, the star, forms. This means that the current trend is losing strength, and the next candle confirms it. The third one initiates a bullish movement that could reverse the price direction.
Therefore, after the third candle is completed, this pattern will generate a buy signal in your strategy.
On-Neck
 The On-Neck is a bearish continuation pattern represented by two candles.
During a downtrend, a long decreasing candle is followed by a small increasing candle with the shape of a Rickshaw man. The latter opens below the previous candle and closes near the previous low.
The first candle pushes the price down aggressively, and the second candle, even though it slightly increases, cannot rise above the first candle's close.
The second one must not have the body above the prior candle's close. This is a key component of the pattern, which suggests that the price can continue falling. Then, this pattern will signal a sell in the strategy.
Piercing
 The Piercing is a bullish reversal pattern represented by two candles.
During a downtrend, the first candle is a long decreasing candle. The second one increases and closes above the midpoint of the previous candle.
During a downtrend, the first candle is still decreasing. However, the next one reacts quickly with a significant increase, to close above the prior candle's midpoint.
This quick bullish reaction of the price has a high probability of leading to a trend reversal or correction. Therefore, when this pattern is spotter, the strategy will signal a buy.
Rickshaw Man
 The Rickshaw Man is a type of Doji and therefore represents indecision in the market.
Bulls and bears fight creating long wicks or shadows, but finally the open and close are practically at the same level.
What differentiates the Rickshaw Man from a normal Doji is its long wicks. The fight between bullish and bearish pressures is more volatile in this type of Doji, which creates long upper and lower wicks.
Due to the Rickshaw Man represents high indecision in the market, it is recommended to use it with other indicators to open or close positions.
Rising Three Methods
 The Rising Three Methods is a continuation bullish pattern represented by five candles.
During an uptrend, an increasing long candle forms, followed by three decreasing candles with small bodies. Finally, an increasing candle with a long body covers the previous three candles and closes above the high of that range.
In a market dominated by the bulls, the price rests and performs a pull-back or flag to thereafter continue increasing.
Once the last candle of the pull-back reaches the opening price of the first candle, the fifth candle of the pattern makes a new high and lead the way to future increases. Therefore, this pattern will generate a buy signal in the strategy.
Separating Lines Bearish
 The Separating Lines Bearish is a continuation bearish pattern represented by two candles.
During a downtrend, a first long bullish candle is followed by another long but decreasing candle that will open at the same price of the previous candle open and make a new low.
In a market dominated by bearish pressures, the first candle of the pattern increases but it's quickly rejected by the bears that push the price down very aggressively.
Therefore, by adding this candlestick pattern to your strategy, it will sell positions or open shorts.
Separating Lines Bullish
 The Separating Lines Bullish is a continuation bullish pattern represented by two candles.
During an uptrend, a first long bearish candle is followed by another long but increasing candle that will open at the same price of the previous candle open and make a new high.
In a market dominated by bullish pressures, the first candle of the pattern decreases but it's quickly rejected by the bulls that push the price up very aggressively.
Therefore, by adding this candlestick pattern to your strategy, it will send a buy signal.
Shooting Star
 The Shooting Star is a bearish reversal pattern represented by one candle.
It is a red candle with a small body and long upper wick.
It is usually found during bullish trends and shows how the bearish pressures heavily reject the price when it tries to keep increasing.
Since this Shooting Star foresees a potential increase of the supply volume, the price is likely to reverse and head downwards. Therefore, this pattern will generate a sell in your strategy.
Short Line Bearish
 The Short Line Bearish is a bearish pattern represented by one candle.
It is a red candle with a very small body and medium size wicks.
It can be found during trending and ranging markets, and anticipates decreases in the price. Its wicks suggest that there is an important component of indecision in the pattern.
Usually, this one candle pattern leads to bearish movements. Therefore, many traders use it to sell positions or open shorts.
Short Line Bullish
 The Short Line Bullish is a bullish pattern represented by one candle.
It is an increasing candle with a very small body and medium size wicks.
It can be found during trending and ranging markets, and anticipates increases in the price. Its wicks suggest that there is an important component of indecision in the pattern.
Usually, this one candle pattern leads to bullish movements. Therefore, many traders use it to open positions.
Spinning Top Bearish
 The Spinning Top Bearish is a bearish indecision pattern represented by one candle.
It is decreasing and has a short body and long wicks on both sides.
The Spinning Top Bearish can be considered as another type of Doji, and as previously mentioned, it is an indecision pattern. However, since it closes below its open, the candle decreases and the pattern has a higher likelihood to lead to falls in the price.
Many traders use this pattern to detect signs of weakness during uptrends. Then, to proceed to close a position or open a short.
Spinning Top Bullish
 The Spinning Top Bullish is a bullish indecision pattern represented by one candle.
It is increasing, has a short body and long wicks on both sides.
The Spinning Top Bullish can be considered as another type of Doji, and as previously mentioned, it is an indecision pattern. However, since it closes above its open, the candle increases and the pattern has a higher likelihood to lead to increases in the price.
Many traders use this pattern to detect signs of weakness during downtrends. Then, proceed to open a long position.
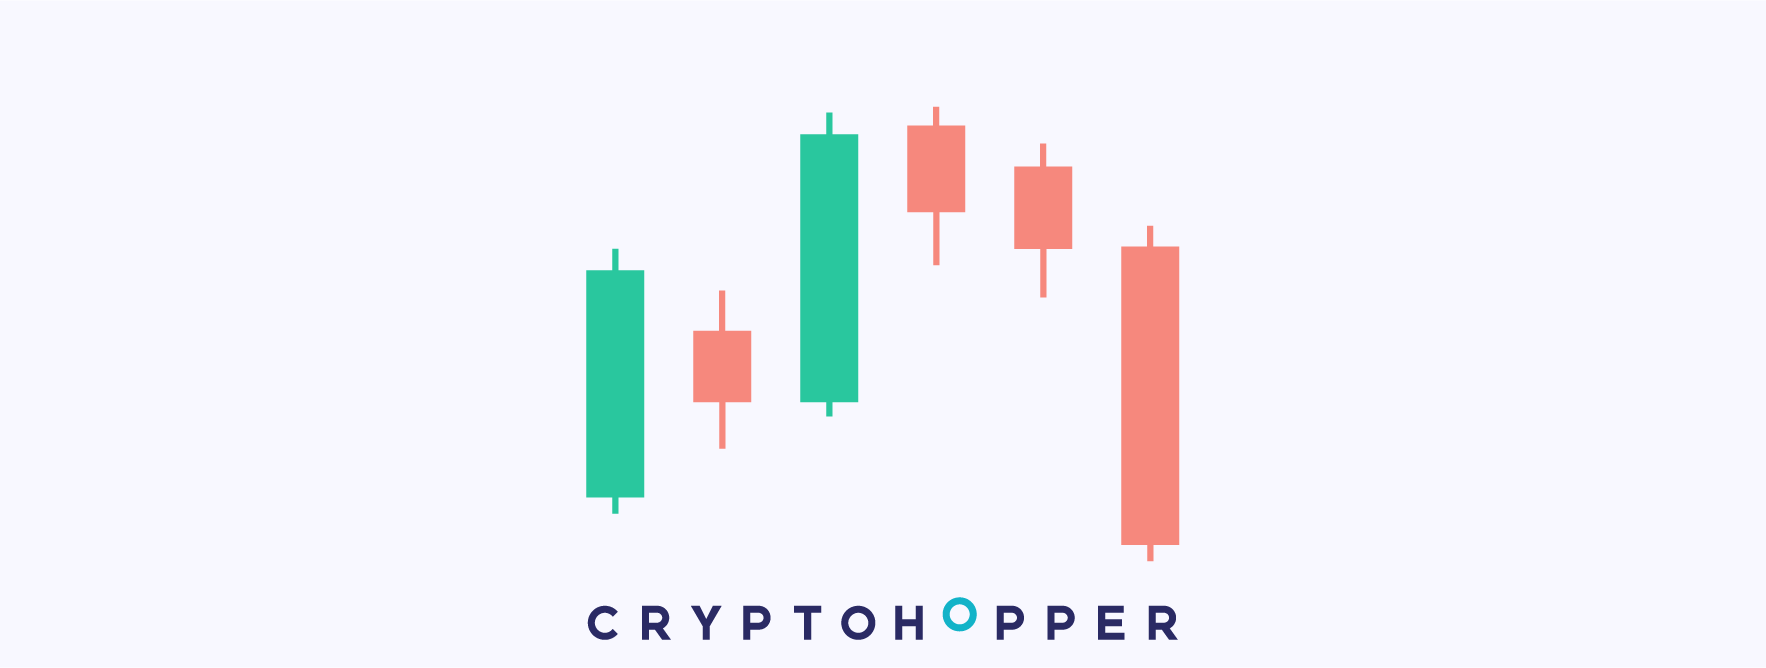
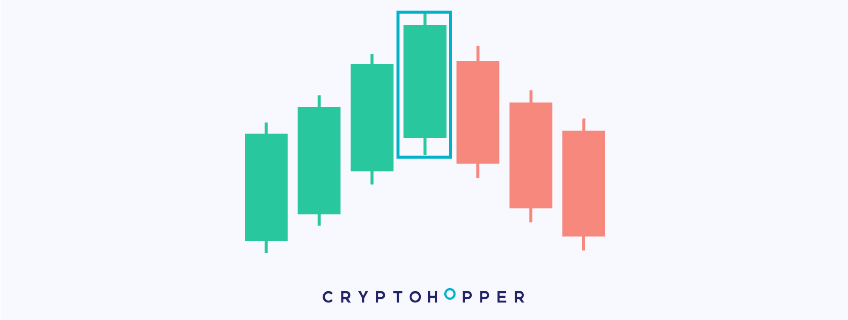
Stalled Pattern Bearish
 The Stalled Pattern Bearish is a bearish pattern represented by three candles.
During an uptrend, the first candle is increasing and has a long body. It is followed by a second candle, also increasing and has a shorter body. Finally, the last candle still increases but doesn't break the previous high, then creates a resistance.
The essence of this pattern is that the bullish trend loses positive momentum and creates a resistance that the price is struggling to break. Then, the price is very likely to perform a pull-back or start a bearish trend.
Usually, traders use this pattern to sell positions or to open a short.
Stalled Pattern Bullish
 The Stalled Pattern Bullish is a bullish pattern represented by three candles.
During a downtrend, the first candle is decreasing and has a long body. It is followed by a second candle, also decreasing and with a shorter body. Finally, the last candle still decreases but doesn't break the previous low, then creates a support.
The essence of this pattern is that the bearish trend loses negative momentum and creates a support that the price is struggling to break. Then, the price is very likely to perform a pull-back or start a bullish trend.
Usually, traders use this pattern to buy an asset.
Stick Sandwich Bearish
 The Stick Sandwich Bearish is a bearish reversal pattern represented by three candles.
During an uptrend, the first candle is increasing and is followed by a second red candle that closes below the previous low. Finally, the third candle increases again and doesn't break the previous high, then creating a resistance.
The Stick Sandwich Bearish shows how the price loses strength and cannot keep making new highs during an uptrend. Then, encountering a resistance.
This resistance ends the upward trend. Therefore, many traders will take this pattern as a signal to close a position or to open a short.
Stick Sandwich Bullish
 The Stick Sandwich Bullish is a bullish reversal pattern represented by three candles.
During a downtrend, the first candle is decreasing and is followed by a second green candle that closes above the previous high. Finally, the third candle decreases again and doesn't break the previous low, then creating a support.
The Stick Sandwich Bullish shows how the price loses strength and cannot keep making new lows during a downtrend. Then, encountering a support.
This support ends the downward trend. Therefore, many traders will take this pattern as a signal to open a long position.
Takuri Line
 The Takuri Line is a bullish pattern represented by one candle.
It is very similar to the famous candlestick pattern Hammer. It is a candle with a short body and a long lower wick.
Like the Hammer, this one candle pattern shows how, after a bearish move, a downward move is quickly rejected by the bulls and the candle closes near its high.
This quick rejection usually means that the price has reached a level of high demand. Therefore, the price is likely to go up. Then, by selecting this pattern in your strategy, it will signal a buy.
Three Advancing White Soldiers
 The Three Advancing White Soldiers is a bullish reversal pattern represented by three candles.
After a downward trend, every candle has a long body and an upward direction.
This pattern is commonly found during downtrends and represents how the bulls react aggressively to the past price declines and push the price up.
Usually, this pattern takes place when the price reaches a level where the demand is very present, which initiates a trend reversal and increases in price. Traders use this pattern to open long positions.
Three Black Crows
 The Three Black Crows is a bearish reversal pattern represented by three candles.
After an upward trend, every candle has a long body and a downward direction.
This pattern is commonly found during uptrends and represents how the bears react aggressively to past price increases and push the price down.
Usually, this pattern takes place when the price reaches a level where the supply is very present, which initiates a trend reversal and falls in price. Traders use this pattern to close positions or open shorts.
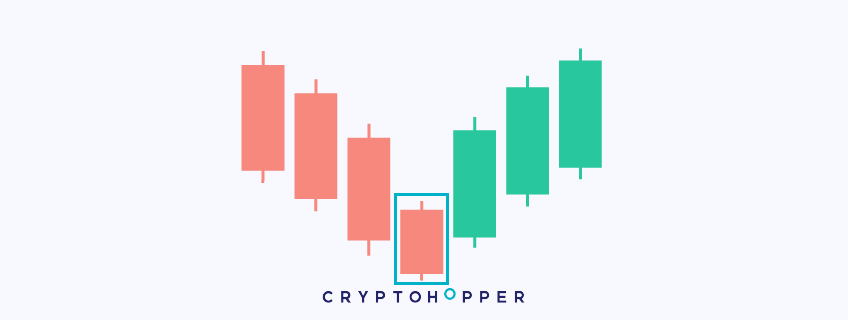
Three Inside Up/Down Bearish
 The Three Inside Up/Down Bearish is a bearish reversal pattern represented by three candles.
During an upward trend, the first candle of the pattern has a long body and is still going up. The next candle decreases, has a small body and closes within the body of the previous one. Finally, the third candle is decreasing and closes below the first candle.
The second candle cannot break the previous high and then, the bears take over and start driving the price down.
Frequently, traders use this pattern to detect future bearish movements. Therefore to sell positions.
Three Inside Up/Down Bullish
 The Three Inside Up/Down Bullish is a bullish reversal pattern represented by three candles.
During a downtrend, the first candle of the pattern has a long body and is still going down. The next candle increases, has a small body and closes within the body of the previous one. Finally, the third candle is increasing and closes above the first candle.
The second candle cannot break the previous low and then, the bulls take over and start driving the price up.
Frequently, traders use this pattern to detect future bullish movements. Therefore to open long positions.
Three Stars In The South
 The Three Stars In The South is a bullish reversal pattern represented by three candles.
During a downtrend, the first candle decreases, has a long body and a long lower wick. The second candle decreases, has a shorter body and doesn't make a new low. The third candle is also decreasing, has an even shorter body than the previous one and is engulfed by the second candle.
This pattern suggests that the bearish move is losing negative momentum as the price advances. The smaller size of the last candles and the fact that they are engulfed by the first candle suggests a bullish reversal.
Because of this, traders use this pattern to open long positions.
Three-Line Strike Bearish
 The Three-Line Strike Bearish is a bearish continuation pattern represented by four candles.
During a downtrend, the first three candles start increasing and have short bodies. The fourth candle will decrease again and engulf the previous three rising candles. Therefore, it will continue with the downtrend.
This pattern shows very well how the price performs a pull-back with the first three small candles, to thereafter continue its way down with the last candle of the pattern.
Therefore, by adding this pattern to your strategy, the strategy will signal a sell.
Three-Line Strike Bullish
 The Three-Line Strike Bullish is a bullish continuation pattern represented by four candles.
During an uptrend, the first three candles start decreasing and have short bodies. The fourth candle will increase again and engulf the previous three candles. Therefore, it will continue the uptrend.
This pattern shows very well how the price performs a pull-back with the first three small candles, to thereafter continue its way up with the last candle of the pattern.
Therefore, by adding this pattern to your strategy, a buy signal will be generated when the pattern appears in a candlestick chart.
Tri-Star Bearish
 The Tri-Star Bearish is a bearish pattern represented by three candles.
During an uptrend, the next three candles are Dojis. The first two ones go upwards and the last one downwards, then probably initiating a downtrend.
As we've mentioned in previous videos, Dojis are indecision patterns, but they can give hints about the future direction of the price. The last Doji of the Tri-Star Bearish suggests that the price is starting a bearish movement.
Many traders use this pattern to detect signs of weakness in trends. Then, to proceed to close a position or open a short.
Tri-Star Bullish
 The Tri-Star Bullish is a bullish pattern represented by three candles.
During a downtrend, the next three candles are Dojis. The first two ones go downwards and the last one upwards, then probably initiating an uptrend.
As we've mentioned in previous videos, Dojis are indecision patterns, but they can give hints about the future direction of the price. The last Doji of the Tri-Star Bearish suggests that the price is starting a bullish movement.
Many traders use this pattern to detect signs of weakness in trends. Then, anticipating an upward movement and opening a long position.
Two Crows
 The Two Crows is a bearish reversal pattern represented by three candles.
During an uptrend, the first candle is still increasing. The next two candles start to decrease and initiate a downward movement.
A small gap between the first candle's close and the second candle's open forms, and it's closed quickly with a bearish candle. Afterward, the bearish pressures keep rising, which creates a third decreasing candle.
Commonly, this pattern leads to a bearish trend reversal, and by selecting it in your trading strategy, it will generate a sell signal.
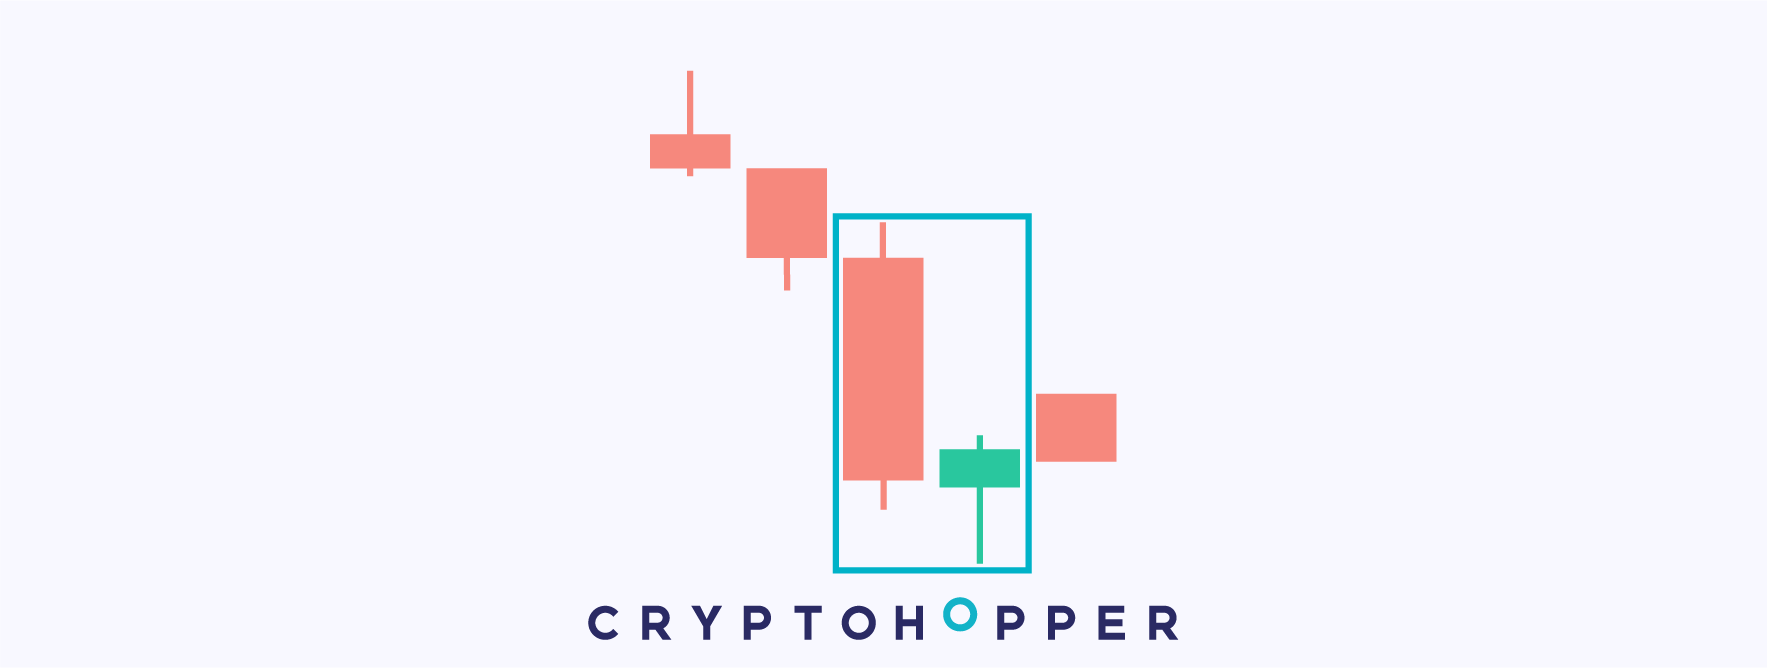
Unique Three River
 The Unique Three River is a bullish reversal pattern represented by three candles.
During a downtrend, the first candle decreases and has a long body. It's followed by a red hammer with a long lower wick. The third candle has a short body and doesn't make any new low or high, although it starts increasing.
The second and third ones are crucial to understand the pattern. The second one is a hammer, and usually, this type of candle suggests that the price has reached a demand zone. Finally, the third candle starts increasing, which confirms that the bearish trend could have ended.
Therefore, many traders will take this pattern as a signal to open a long position.
Up-Gap Side-By-Side White Lines Bullish
 The Up-Gap Side-By-Side White Lines Bullish is a bullish continuation pattern represented by three candles.
During an uptrend, the first candle increases. The second candle opens above the close of the previous candle, then making a gap. The third candle is similar to the previous one, but its minimum is higher.
The bullish pressure has been so big, that the price has created an Up-Gap. The next two candles keep increasing, which tells us that the price hasn't finished the bullish trend yet.
Generally, this pattern precedes a rise in the price. Therefore, it will generate a buy signal.
Upside Gap Three Methods Bearish
 The Upside Gap Three Methods Bearish is a bearish reversal pattern represented by three candles.
During an uptrend, the first candle increases and has a long body. The second candle also increases and opens above the high of the previous one, then featuring a gap. The third one starts decreasing and closes within the body of the first candle.
Many times, the gaps are quickly closed by the next candle or candles. In this particular case, the gap is quickly closed by a decreasing candle, which is very likely to initiate a trend reversal.
Many trades use this pattern as a signal to close positions or open shorts.
Upside Gap Two Crows
 The Upside Gap Two Crows is a bearish reversal pattern represented by three candles.