Technical indicators
This article shows all Techical Indicators that Cryptohopper offers. These indicators can be divided in four different types. Read more about the different types of Technical Indicators here.
Absolute Price Oscillator (APO)
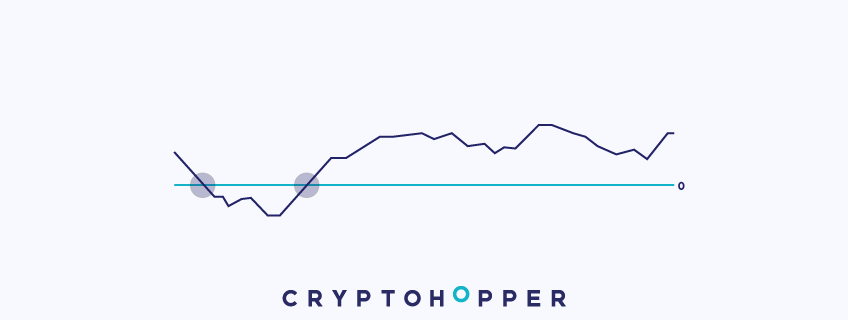
Although it looks like an oscillator on the chart, as pictured above, the Absolute Price Oscillator is essentially a moving average crossover strategy. Crossovers are one of the most-used moving average strategies. With a moving average crossover, you need to apply two moving averages to a chart: a shorter one and a longer one.
When the shorter-term moving average crosses above the longer-term moving average, it sends a buy signal to your hopper, because it indicates that the trend is shifting up. Meanwhile, when the shorter-term moving average crosses below the longer-term moving average, it sends a sell signal to your hopper, since it indicates that the trend is shifting down.
The indicator is displayed as a line oscillating around zero. The line represents the difference between the short and the long moving average. When the line crosses above 0, it means that the shorter moving average crossed above the long moving average, which triggers a buy signal.
Similarly, when the line crosses below 0 it means the shorter moving average crossed below the long moving average, which triggers a sell signal.
One of the great aspects of this indicator on Cryptohopper is that you can combine multiple types of moving averages. For example, you can combine a Simple Moving Average with an Exponential Moving Average to make a unique strategy.
Aroon
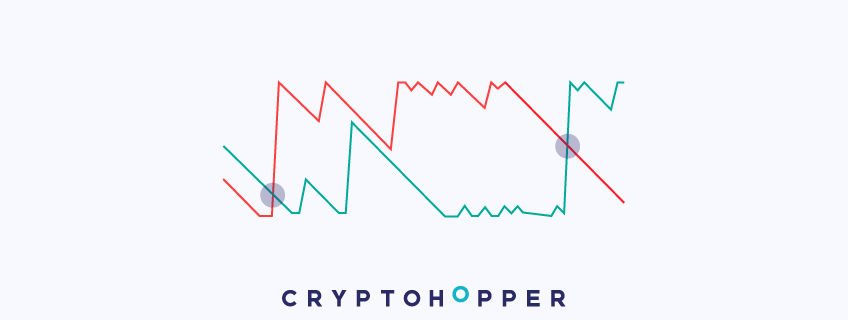
Aroon can be considered a momentum oscillator, but it is also used to spot trends. Aroon is represented by two lines, Aroon up and Aroon down, and fluctuate between 0 and 100.
Aroon up measures the frequency of new highs during uptrends. If the price is continuously rising and making new highs, Aroon up will be 100 and Aroon down 0. However, when the price is not making new highs, it means that the uptrend is fading out and we can have a correction or trend reversal. If it starts making new lows, Aroon down will be 100 and Aroon up 0.
It generates buy and sell signals through crossovers. When Aroon up crosses Aroon down upwards, the price can be initiating a positive trend and it signals a buy. On the other hand, when Aroon down crosses Aroon up upwards, it will send a sell signal.
Aroon Oscillator
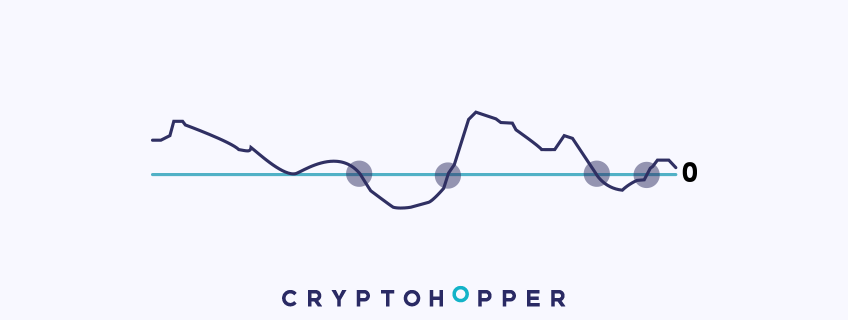
Aroon can be considered a momentum oscillator, but it is also used to spot trends. The Aroon Oscillator calculates the difference between Aroon Up and Aroon Down (from Aroon), and is plotted in a graph that ranges from -100 to +100.
The Aroon Oscillator works essentially the same as the regular Aroon and provides the same buy/sell signals (if you give them the same periods). Therefore, the only difference between the two indicators is visual.
That is because when Aroon Up is bigger than Aroon Down, the difference will be positive, and both the Aroon Oscillator and the regular Aroon will send a buy signal, and vice versa for sell signals.
Average Directional Movement (ADX)
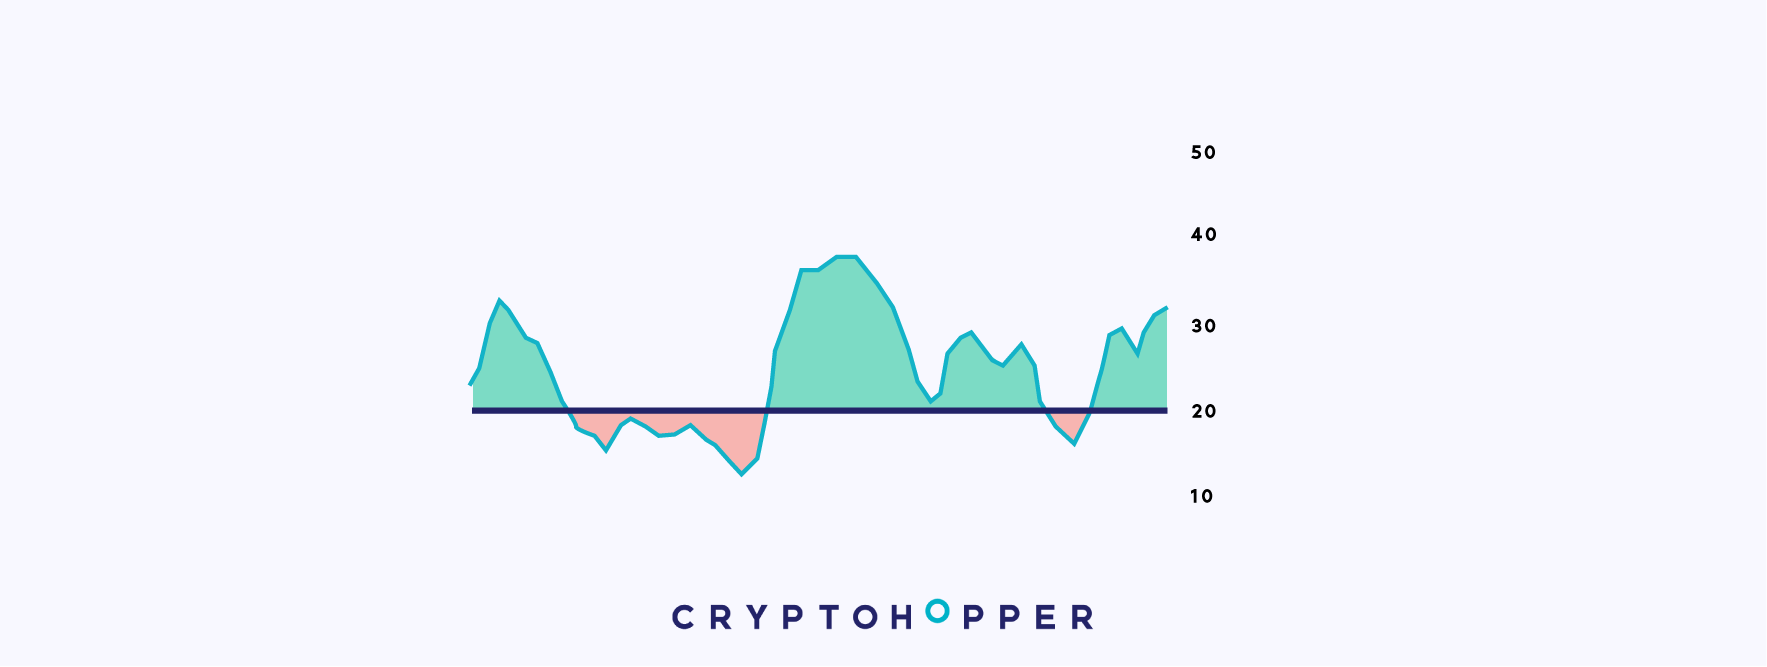
The Average Directional Movement (ADX) is a useful indicator invented by J. Welles Wilder to measure the strength of a trend.
When a coin does not have strong trend and it’s just ranging, the ADX will remain low, likely with a value below 20. However, when the coin starts to have a clear direction, either to the upside or to the downside, the ADX will rise.
This indicator is commonly used to anticipate the end of ranging markets and the beginning of a new trend.
The ADX generates signals when it rises above a specific threshold. When it's above the threshold, the indicator will send a buy or sell signal (depending on how you configure it). Likewise, if the ADX is below the threshold, it will not send a signal.
ADX is only available for users with a Hero subscription.
Average True Range (ATR)
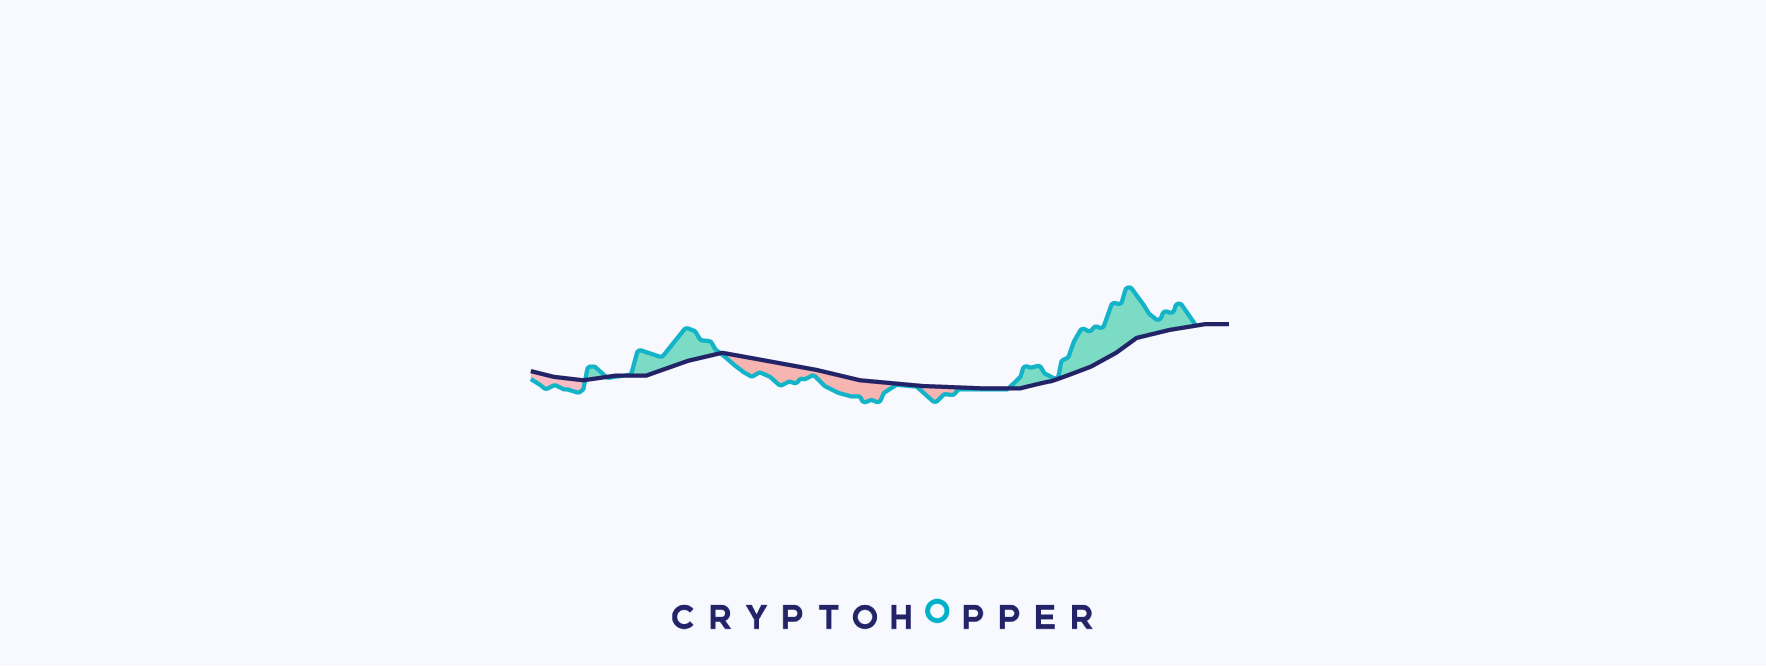
The ATR was invented by J. Welles Wilder in the late seventies. It is a volatility indicator. When the volatility of the market increases, the ATR line goes up.
This indicator analyses the volatility of the asset. When the market is rather ranging, it remains low. However, when the market starts moving quickly in one direction, doesn't matter if it's up or down, the ATR will start rising.
It can be a very good indicator to spot when the big investors are entering the market to buy or sell.
We have added a moving average of the ATR line to generate signals. In this way, when volume starts flooding the market and the volatility peaks, the ATR line will rise above its moving average. Likewise, when the volatility falls and the market ranges, the ATR line will fall below its moving average.
Last but not least, unlike with other indicators, the ATR does not generate buy or sell signals since it measures the volatility of the market. Therefore, the price can be going up or down.
Then, how can you use this indicator in your automated strategy? It can be described as a volatility filter. When the ATR line goes above the moving average, the market is more volatile and the price is moving, then the ATR will let another indicator(s) to give a buy or sell signal. However, when the volatility is low and the price is ranging, the ATR is below its moving average, and it won't let another indicator(s) to give any buy or signal.
Therefore, it filters out trades when the market volatility is low and the price doesn't move much and let your strategy trade when the market is volatile and the price is trending.
ATR is only available for users with a Hero subscription.
Bollinger Bands (BB)
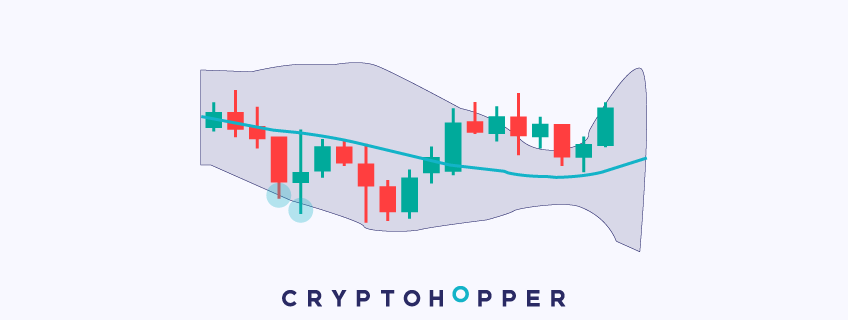
The Bollinger bands, created by John Bollinger in the eighties, measures the volatility of the price through the deviation of two bands, an upper and lower band, from the moving average.
The upper and lower lines shrink when the price barely changes during a specific time frame. However, if there is high volatility, both two lines widen to capture these volatility levels.
This indicator has different applications. Among them, traders frequently use the upper and lower bands to carry out their strategy.
The lower band is used for the buying strategy. Once the price has broken it, the indicator suggests that the likelihood of the price retracing or initiating an upward trend is high. On the other hand, the upper band will help you to pinpoint sell or short points.
Chaikin A/D Oscillator
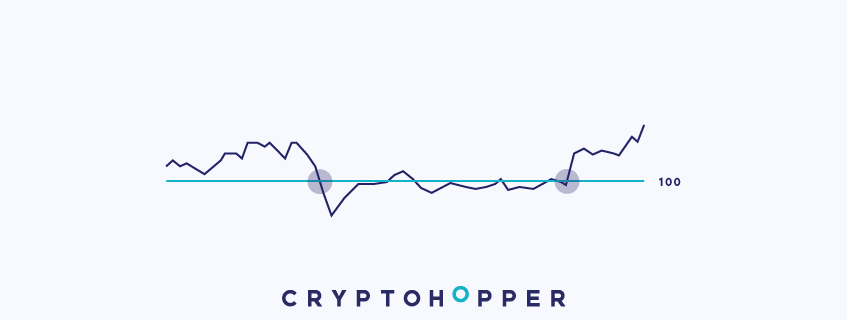
Marc Chaikin invented the Chaikin Accumulation/Distribution Oscillator as an “indicator of an indicator” that uses the Accumulation/Distribution line in its calculation.
The Chaikin A/D Oscillator is a momentum indicator that adds volume to its analysis. As many traders say, price follows volume, and this indicator is used to analyze the current momentum of the price to predict future price movements.
Although it has “Oscillator” in its name, it actually works pretty different from most other oscillators on Cryptohopper, and more like a momentum indicator. The Chaikin A/D Oscillator fluctuates around the value zero. Every time that the indicator changes from positive to negative, it suggests that the momentum of the price is changing.
When the indicator crosses the zero line upwards, it means that the price is gaining bullish momentum, which generates a buy signal. Likewise, when the indicator crosses the zero line downwards, the bearish momentum is taking over, which signals a sell.
Commodity Channel Index (CCI)
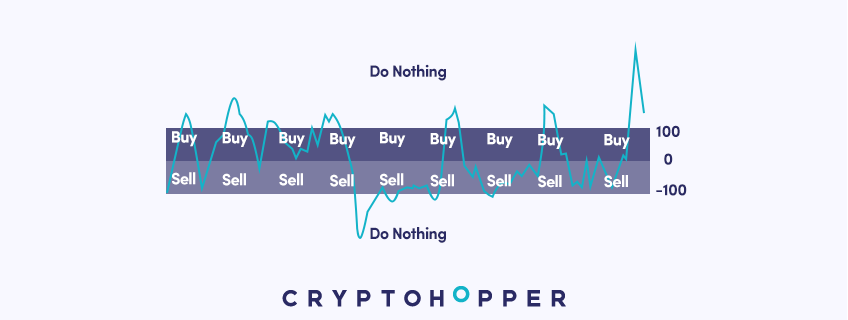
The Commodity Channel Index (CCI) was developed by Donald Lambert in 1980. Although it’s a momentum indicator, the CCI works differently from other momentum indicators on Cryptohopper.
The CCI fluctuates around the value zero. When the price rises, the CCI line increases. Alternatively, when the price decreases, so does the CCI.
When the CCI is between 0 and -100, it sends a buy signal, and when it’s between 0 and 100 , it sends a sell signal. These are sticking signals, meaning that as long as the CCI is between 0 and -100, a buy signal is given, and as long as the CCI is between 0 and 100 it will send a sell signal. More extreme signals over 100 and under -100 will result in neutral signals.
Directional Movement Index (DMI)
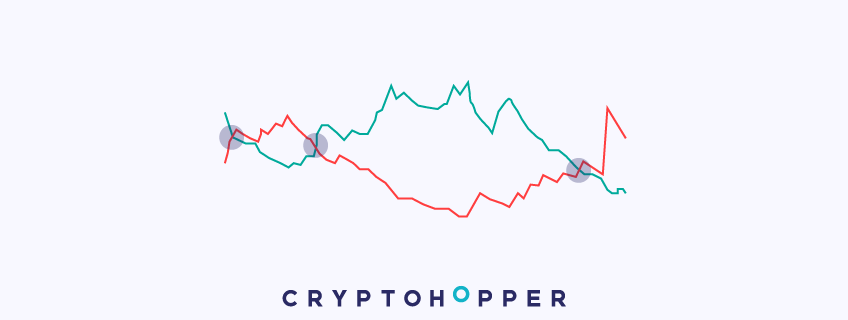
The Directional Movement Index (DMI) was created by J. Welles Wilder and has two lines: the positive and negative directional movement.
The two lines measure the strength of positive and negative trends. When the positive directional movement line is above the negative one, then the bullish pressure is larger than the bearish one. If the negative line is above, then the bears will be dominating the market.
The DMI sends a buy signal when the positive directional movement line (green line) crosses above the negative directional movement line (the red line). When the positive directional movement line (green line) crosses below negative one (the red line), it sends a sell signal. We specifically said crossing because it uses non-sticking signals, so it only sends the signals once, at the crossovers.
Double Exponential Moving Average (DEMA)

The DEMA is a trend indicator. Its main characteristic is a faster reaction to price movements. Therefore, it reduces the lag between the price and moving average.
As we argued in the EMA video, it is faster than a normal SMA. The DEMA increases to a greater extent the speed of the EMA. So, if you would like to use a very fast moving average, the DEMA can be a good option.
Like other moving averages, the DEMA is usually traded through crossovers between the fast and slow moving average.
When the fast moving average crosses the slow one upwards, the price is likely to begin a bullish trend and a buy signal is generated. Likewise, when the fast moving average crosses the slow one down the opposite happens, the bears are taking over and it sends a sell signal.
Elder Ray
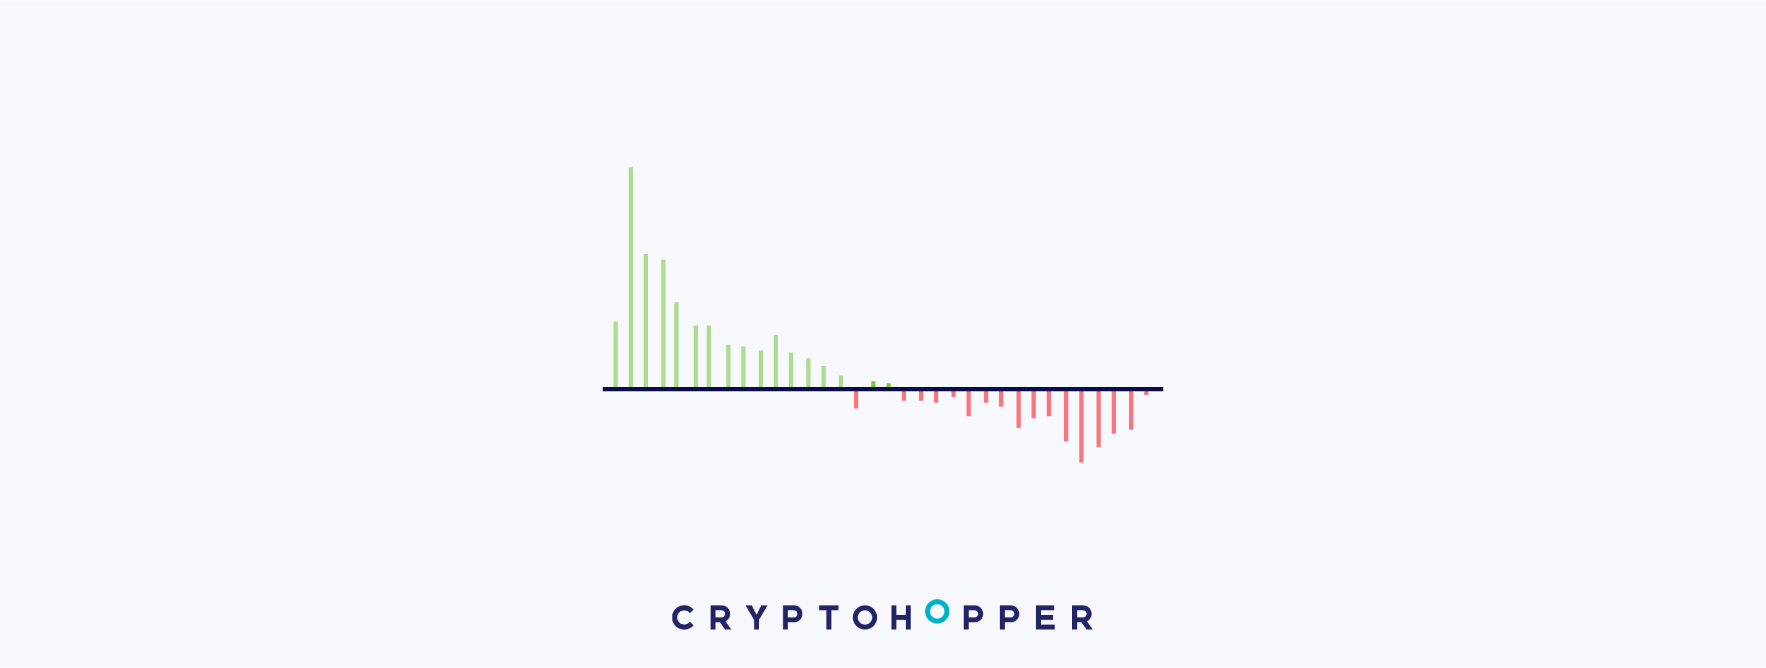
The Elder Ray is an oscillator that combines components of trend and momentum indicators to measure the strength of the bullish and bearish trends. The indicator labels the trends as "bull power" and "bear power", respectively.
The Elder Ray combines exponential moving averages (EMA) to generate signals and pinpoint the dominant power of the market based on an asset’s trending direction. When it's upward, most of the traders become bullish, and when it's downward, they become bearish.
The Elder Ray uses sticking signals. Therefore it signals a buy for as long as the bull power is larger than the bear power. Likewise, it signals a sell for as long as the bear power is larger than the bull power.
Elder Ray is only available for users with a Hero subscription.
Exponential Moving Average (EMA)

An EMA is a very common trend indicator. It reacts quicker than the Simple Moving Average to price changes.
How does it do it? The EMA gives greater weight to the latest closing prices of the moving average. That is, the most recent price levels will determine to a greater extent the development of the moving average.
Like the SMA, traders use this indicator to spot trends and trend reversals. This is done by crossovers between a fast and a slow moving average.
When the fast moving average crosses the slow one upwards, a buy signal will be generated since the price can be starting a bullish trend. On the other hand, when the fast moving average crosses the slow one downwards the opposite happens, the bears are taking over and a sell signal is open.
Hull Moving Average (HMA)
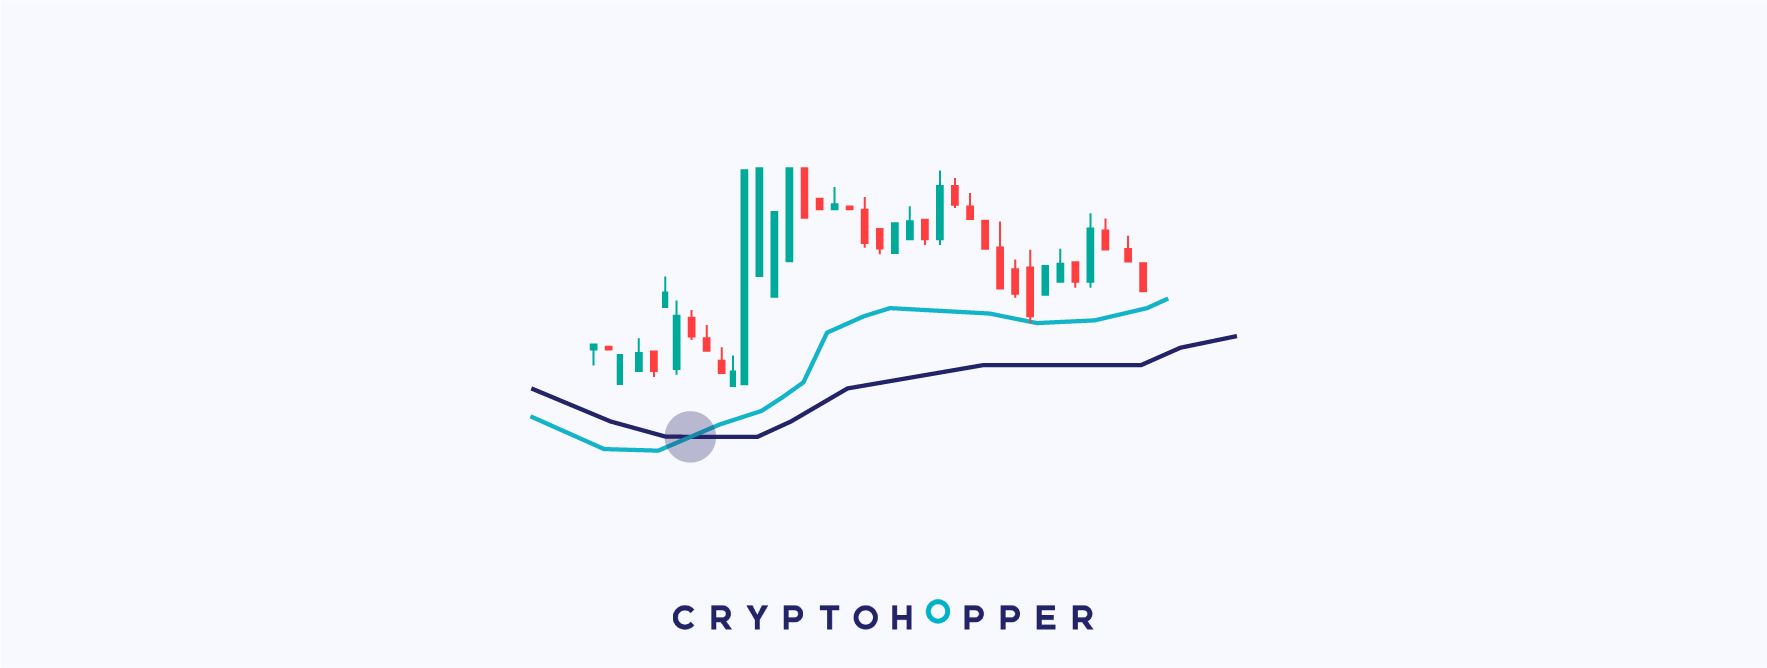
Developed by Alan Hull, the Hull Moving Average is a very fast trend indicator.
Moving averages are used to smooth price fluctuations and spot changes in the trend direction. In this case, the Hull moving average is much faster than an EMA or WMA. It gives more weight to recent price levels. Therefore, it will react very quickly to changes in the price direction.
The Hull moving average, as other similar indicators, generate signals by crossovers between a fast and slow moving average.
When the fast moving average crosses the slow one upwards, the price is bullish and a buy signal is generated. However, when the fast moving average crosses the slow one downwards, the bears are taking over and a sell signal is sent.
HMA is only available for users with a Hero subscription.
Ichimoku Cloud

The Ichimoku Cloud was created by Goichi Hosada in 1969. It has components of trend and momentum indicators and is compound by five lines.
It includes several moving averages of which two create the so-called cloud. The cloud is the key component of this indicator, and all the entry and exit points will depend on it.
The Ichimoku Cloud has different applications. The most common one generates buys and sells when the price crosses the cloud up and downwards.
When a candle breaks the cloud upwards and closes above it, the price is gaining bullish momentum and generates a buy signal. Likewise, if the price breaks the cloud downwards and closes below it, the price is likely to fall. Therefore it will close a position or open a short.
Ichimoku Cloud is only available for users with a Hero subscription.
Kaufman's Adaptive Moving Average (KAMA)

Developed by Perry Kaufman, the KAMA is a trend indicator used to identify the overall trend. It does this by smoothing out the noise when the price fluctuates.
In order to account for the volatility of the market, KAMA introduces a so-called efficiency ratio. This factor will reduce the moving average fluctuations when the volatility is peaking. In other words, it will give less importance to trends with very high volatility.
This indicator is frequently used to spot trends and trend reversals.
As the other moving averages we've previously seen, buys and sell signals are generated through bullish and bearish crossovers. A bullish crossover takes place when the fast moving average crosses the slow one upwards, which would open a position. Bearish crossovers are the opposite, and will close a position or open a short.
MESA Adaptive Moving Average

The MESA adaptive moving average is a trend-following indicator. It adapts to price movements in a very unique way, based on the rate of change (ROC), as measured by the Hilbert Transform Discriminator.
Like other moving averages, traders use this indicator to spot trends and trend reversals. This is done by crossovers between a fast and a slow moving average.
When the fast moving average crosses the slow one upwards, a buy signal is generated, and will hold this signal until a bearish crossover takes place. Likewise, when the fast moving average crosses the slow one downwards, it will signal a sell until a bullish crossover takes place.
Unlike other moving averages, MESA won't only give a signal when the crossover between moving averages has taken place. It will signal a buy or a sell until the next crossover occurs.
Momentum Indicator
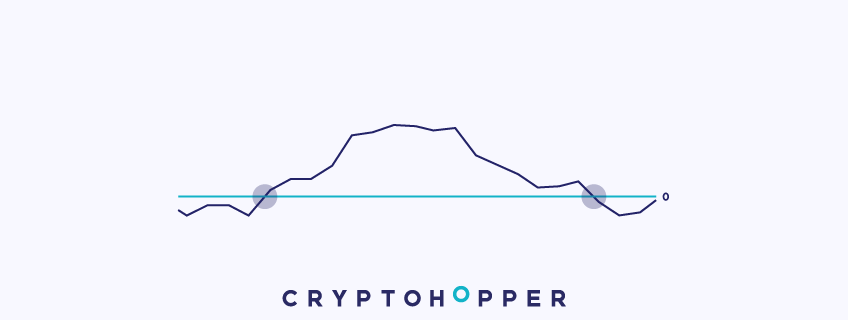
As its name suggests, this indicator purely analyzes the momentum of the price. It is measured by comparing the current price to it a specific number of periods ago.
If the current price is higher than it was, for example, ten periods ago, the momentum line increases. On the other hand, when the current price is lower than the one in the past, the line decreases.
A trader can obtain buy and sell signals when the momentum changes its sign.
The Momentum indicator switches from positive to negative, and the other way around, depending on price changes.
When it changes from negative to positive, the bulls are more present in the market and the indicator signals a buy. However, if the momentum line goes the negative area, it means that the bears are taking over, which generates a sell signal.
You can easily combine the Momentum with other indicators in the section Strategy.
Money Flow Index (MFI)
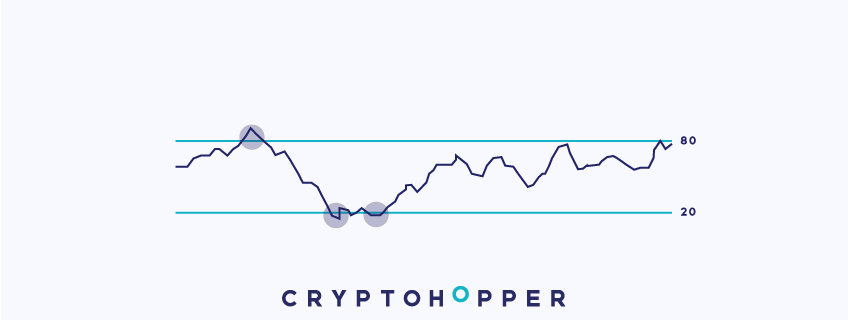
The Money Flow Index (MFI) is also known as "the RSI that accounts for volume". It’s an indicator that combines volume and price to carry out its analysis.
The MFI is a momentum oscillator and can also be considered a volume one. It measures the flow of money into and out of an asset along with price changes to identify oversold and overbought zones.
Overbought zones are areas where the price and volume have risen significantly in a small interval of time, which suggests that a trend reversal can occur. Oversold zones are the opposite; they are areas where the price and volume have decreased suddenly.
The classic way of trading with the MFI is to buy when the MFI is oversold and to sell when it is overbought. However on Cryptohopper, we leave a lot of room for customization. You can set the MFI to send a buy/sell signal when the indicator is below or above, or even equal to, a certain value. This means that you can even inverse the signals and buy at overbought and sell at oversold, which makes the MFI work like a trend following indicator.
It’s important to note that if you select “greater than” or “less than”, the MFI will send sticking signals. This means that it will keep sending buy/sell signals as long as the MFI is above or below a certain value. This feature makes the MFI a great indicator to combine with others.
Moving Average Convergence Divergence (MACD)

The Moving Average Convergence Divergence (MACD) indicator was created in the late seventies by Gerald Appel. It’s a combination of a trend and momentum indicator.
It is comprised of two lines: the MACD and signal line. Both lines oscillate around the zero line.
The MACD gives a buy signal when the MACD line (which is displayed above as the blue line) crosses above the signal line (which is displayed on the chart as the purple line). This can also be visualized by the histogram turning green.
The MACD gives a sell signal when the MACD (blue line) crosses below the signal line (purple line). This can also be visualized by the histogram turning red.
The MACD offers non-sticking signals, so it only sends signals at the crossovers. Crossovers are also visualized when the histogram changes color.
On Balance Volume (OBV)
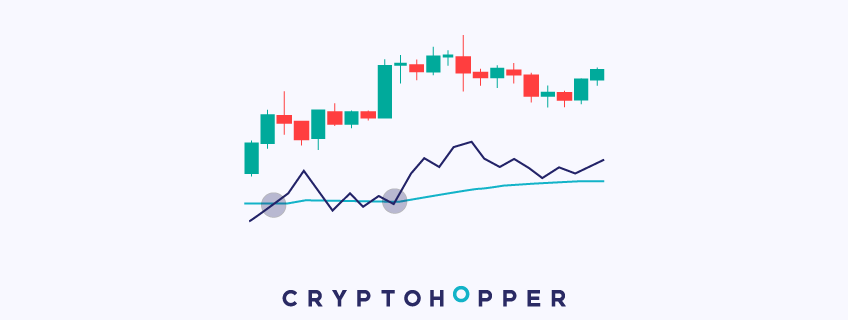
The OBV is a momentum and volume indicator. It combines price and volume in its calculation, and is represented with a line at the bottom of the chart.
This indicator can give crucial insights into the volume of a market. It will rise once the volume and price are increasing hand in hand. However, as soon as the price starts going down, the line will decrease since it assumes that the volume is more likely to be supply.
We can conclude that every time that the OBV line increases, the volume is pushing the price up, which can be used to generate buy signals. On the other hand, when it decreases, the price is losing momentum and it is likely to go down, which can give a selling opportunity. In order to generate buy and sell signals, we added a moving average to the OBV. In this way, when the OBV crosses its moving average upwards, it means that the price and volume are increasing and a buy signal is generated. Likewise, when the OBV line crosses downward its moving average, the price is starting to fall and the indicator sends a sell signal.
You can find this indicator in TradingView by typing "Cryptohopper OBV".
Parabolic SAR
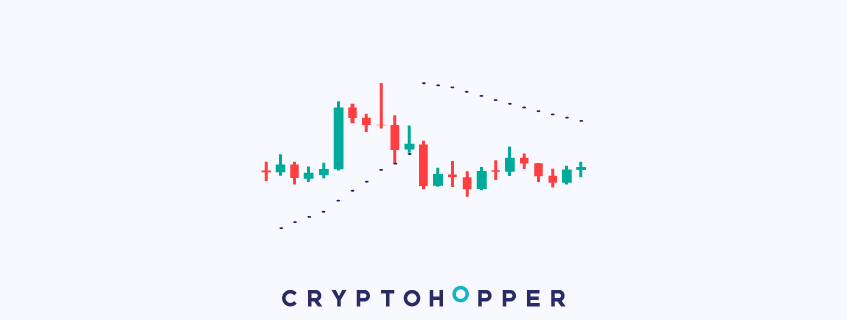
The Parabolic SAR is a trend-following indicator invented by J. Welles Wilder, who also brought us the RSI and ATR.
The Parabolic SAR is displayed by a series of dots above or below the price. If the dots are below the price, then the trend direction is bullish, and when they’re above it, it’s bearish. Therefore, as long as the dots are below the price, it will give buy signals, and as long as the dots are above the price, it will give sell signals. These are sticking signals, so it will continue to send buy/sell signals as long as the conditions are met.
This makes the Parabolic SAR a great indicator to use together with other indicators. For example, the Parabolic SAR can be used to find the overall trend on the larger timeframe, and an oscillator on a smaller timeframe can find the pullbacks of the overall trend.
Percent Change
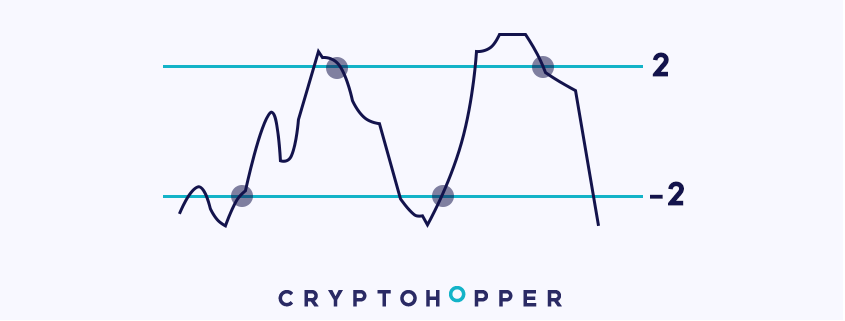
The Percent Change indicator looks at how much a coin has gone up or down percentage-wise in a specific number of periods. For example, if you set the indicator at the 4-hour chart Period and the Period value at 5, then the Percent Change will look at the past 20 hours (5 *4H = 20H).
The Percent Change offers sticking signals if you set the option “Signal when value is:” to anything other than “=”. This means that the Percent Change indicator will continue to send signals as long as the condition is true. For example, if you set the Percent Change to send a buy signal when the value is “Less than or equal to 2”, then it will send a buy signal for as long as the coin moves less than 2% for the specific Period and Chart Period that you set.
For percentage change, it’s important to be careful when you make the value positive or negative. If you set the value at a positive 2, then it will be registered as 2%. If you set -2 then it will be taken as -2%.
The Percent Change indicator is generally a great one to combine with other indicators, since it provides sticking signals. The MESA is generally a good option to combine with the Percent Change. For example, you can use the MESA to find an uptrend and then once the price pulls back in the uptrend, you can use the Percent Change to buy in. These are just examples though, and not advice on how to configure your strategies.
Percentage Price Oscillator (PPO)

The Percentage Price Oscillator (PPO) looks and works almost exactly as the MACD if they have the same values (which you can set in the strategy designer). That said, the Percentage Price Oscillator is slightly more reactive than the MACD, even with the same values.
Just like the MACD, the PPO sends a buy signal when the blue line (here it is called the Fast Moving Average) crosses above the yellow line (here it is called the Slow Moving Average). When this happens, the histogram also turns green.
The PPO then sends a sell signals when the blue line (Moving Average) crosses below the yellow line (Slow Moving Average).
The PPO offers non-sticking signals, so it only sends signals at the crossovers, which are also indicated when the histogram changes color.
Rate Of Change (ROC)
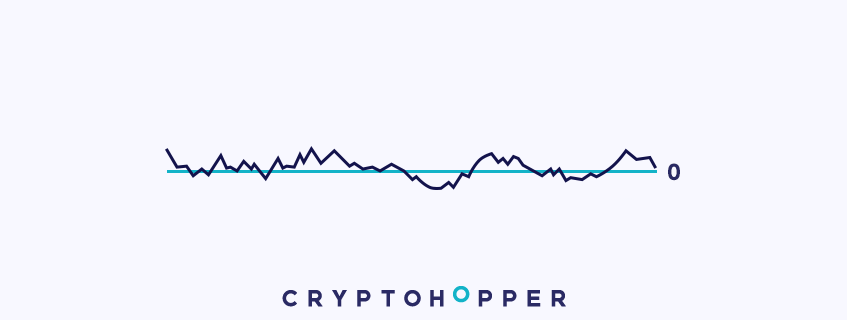
The Rate of Change (ROC) is a momentum indicator. It measures the percentage change between the current price and the price a specific number of periods in the past.
This indicator is commonly used to spot trading opportunities based on changes between positive and negative momentum. The ROC on the chart looks like a momentum line oscillating around the 0 line.
The ROC sends a buy signal when the momentum turns positive, so when the momentum line crosses above 0. It then sends a sell signals when the momentum turns negative, so when the momentum line crosses below 0.
Relative Strength Index (RSI)
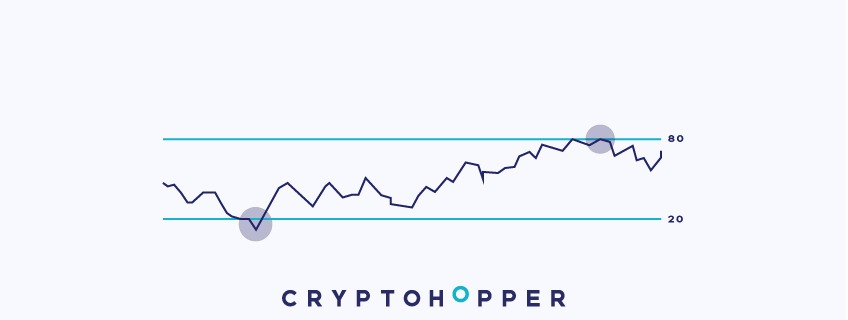
The Relative Strength Index (RSI) was invented by J. Welles Wilder in the late seventies. It is an oscillator that measures the momentum of the price. When the RSI is increasing, the bulls are taking over the market. If it decreases, then the bears are in charge.
The RSI can be used in different trading styles and for various purposes. Usually, traders all around the globe use the indicator by defining overbought and oversold zones.
Overbought zones are areas where the price has risen significantly in a small interval of time, which suggests that a trend reversal can occur. Oversold zones are the opposite; they are areas where the price suddenly decreased.
The classic way of trading with the RSI is to buy when the RSI is oversold and to sell when it’s overbought. However on Cryptohopper, we leave a lot of room for customization. You can set the RSI to send a buy/sell signal when the indicator is below, above, or even equal to a certain value. This means that you can inverse the signals to buy at overbought and sell at oversold, making it work like a trend following indicator.
It’s important to note that if you select “greater than” or “less than,” the RSI will send sticking signals. This means that it will keep sending buy/sell signals as long as the RSI is above or below a certain value. This feature makes the RSI a great indicator to combine with others.
RSI With Region Crossovers
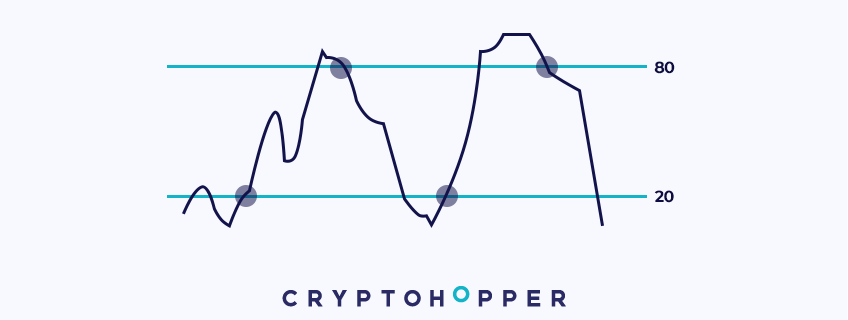
The RSI with Region Crossovers shares the same values as the regular RSI, but it is used differently. The indicator has two modes: Signal on region IN (default), and Signal on region OUT.
Signal on region IN:
With this setting, instead of signaling a buy when the RSI is below a certain threshold (for example 30), it will only signal a buy when the RSI goes from below the threshold and back into the neutral zone. So in our example it will send a buy signal when the indicator crosses back above 30 after being below it.
The same is true for sell signals. Instead of, for example, signaling a sell when the RSI is above a certain threshold (for example 70), it will only signal a sell when the RSI goes from above the threshold back into the neutral zone. So in our example it will send a sell signal when the indicator crosses back below 70 after being above it.
Signal on region OUT:
This setting makes the RSI with Region Crossovers work like the regular RSI. It sends a buy signal when the RSI crosses below a certain threshold, for example 30. So if the current values is 45 and it then it crosses below 30, it would send a buy signal. This is very similar for the sell signals. It will send a sell signal when the RSI crosses above a certain value.
Simple Moving Average (SMA)
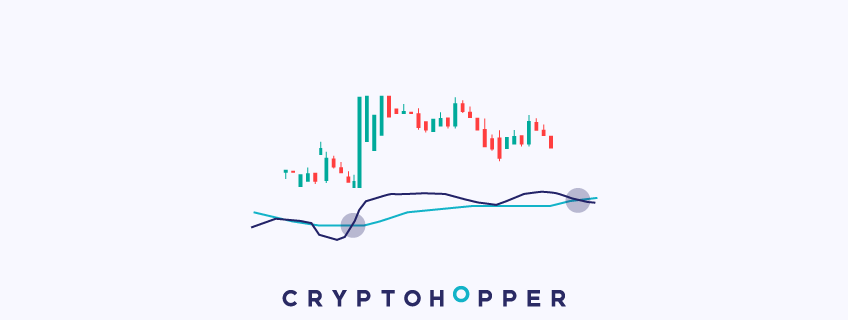
The Simple Moving Average is a common tool for traders to analyze the general trend of a price. The SMA is a trend indicator that smooths price movements to filter out the noise of an asset.
Traders frequently use this indicator to open and close trades through moving averages crossovers, and to find mobile support and resistance levels in different time frames.
These crossovers are generated by predefining two moving averages: a slow and a fast one. The slow SMA takes into account a larger amount of periods, thus catching the general trend of the asset. And the fast SMA is calculated with fewer periods, reacting quicker to price movements.
When the fast SMA crosses above the slow one, it sends a buy signal. On the other hand, when the fast SMA crosses below the slow one, it sends a sell signal.
Stochastic (Stoch)
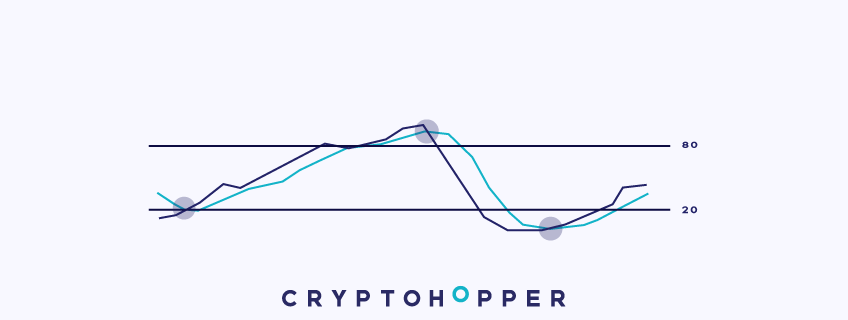
The Stochastic, or Stoch, is a momentum indicator developed by George C. Lane in the 1950s. It’s similar to the RSI, but more volatile.
It compares the closing price of a candle with previous price levels to determine if the price is overbought or oversold.
Overbought zones are areas where the price has risen significantly in a small interval of time, which suggests that a trend reversal can occur. Oversold zones are the opposite. They are areas where the price decreased suddenly.
It’s important to note that there are two lines with the Stochastic: the %K and %D lines. On Cryptohopper we make an average out of the two lines. After that, the Stochastic work in essentially the same way as other oscillators on Cryptohopper such as the RSI or Williams %R. So you can set the Stochastic to send buy/sell signals when the indicator is below, above, or even equal to a certain value. This means that you can even inverse the signals and buy at overbought and sell at oversold, making it work like a trend following indicator.
An essential feature to know is that if you select “greater than” or “less than”, the Stochastic will send sticking signals. This means that it will keep sending buy/sell signals as long as the Stochastic is above or below a certain value. This feature makes the Stochastic a great indicator to combine with others.
Stochastic RSI (StochRSI)
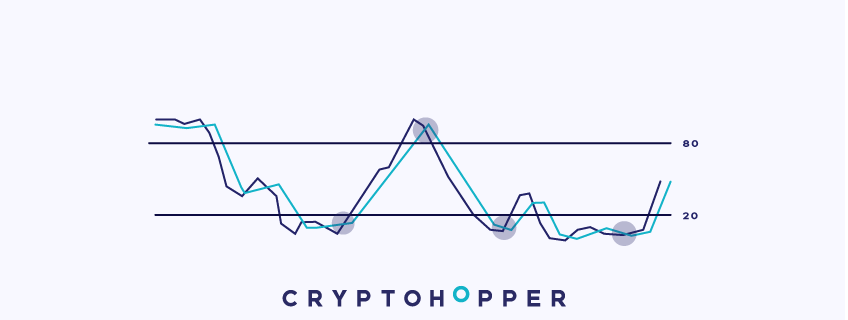
The Stochastic RSI (StochRSI) indicator works similarly to the Stochastic. It combines the Stochastic and RSI indicators in its calculation, making it an indicator of an indicator.
Specifically, the StochRSI applies the Stochastic formula to RSI values instead of price data. This new calculation results in a more volatile indicator than the Stochastic.
Overbought zones are areas where the price has risen significantly in a small interval of time, which suggests that a trend reversal can occur. Oversold zones are the opposite. They are areas where the price decreased suddenly.
It’s important to note that the StochRSI has two lines: the %K and %D lines. On Cryptohopper we make an average out of the two lines just like with the regular Stochastic. After that, the StochRSI works essentially in the same way as the other oscillators on Cryptohopper, such as the RSI or Williams %R. So you can set the StochRSI to send a buy/sell signal when the indicator is below, above, or equal to a certain value. This means that you can even inverse the signals to buy at overbought and sell at oversold, making it work like a trend following indicator.
Keep in mind that if you select “greater than” or “less than,” the StochRSI will send sticking signals. This means that it will keep sending buy/sell signals as long as the StochRSI is above or below a certain value. This feature makes the StochRSI a great indicator to combine with others.
Stochastic With Region Crossovers
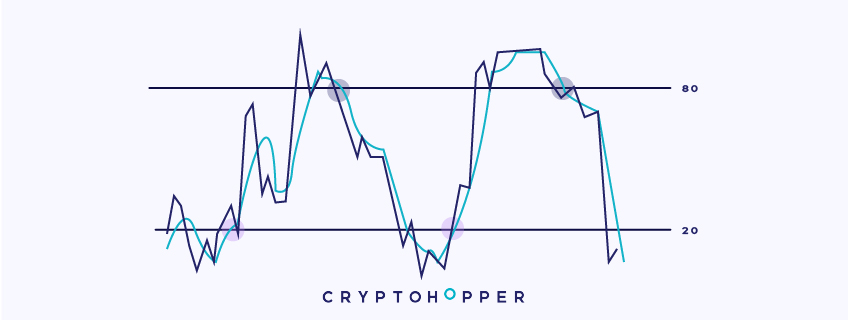
The Stochastic with Region Crossovers shares the same values as the regular Stochastic, but it is used in a different way. It’s important to note that with the Stochastics you have two lines: the %K and %D lines. On Cryptohopper we make an average out of the two lines. The indicator has two modes: Signal on region IN (default) and Signal on region OUT.
Signal on region IN:
With this setting, instead of , for example, signaling a buy when the Stochastic is below a certain threshold (for example 30), it will only signal a buy when the Stochastic goes from below the threshold back into the neutral zone. So in our example it will send a buy signal when the indicator crosses back above 30 after being below it.
The same is true for sell signals. Instead of, for example, signaling a sell when the Stochastic is above a certain threshold (for example 70), it will only signal a sell when the Stochastic goes from above the threshold back into the neutral zone. So in our example it will send a sell signal when the indicator crosses back below 70 after being above it.
Signal on region OUT:
This setting makes the Stochastic with Region Crossovers work like the regular Stochastic. It sends a buy signal when the Stochastic crosses below a certain threshold, for example 30. So if the current values is 45 and it then it crosses below 30, it will send a buy signal. This is very similar for the sell signals. A sell signal will be sent when the RSI crosses above a certain value.
Stochastic with Region Crossovers is only available for users with a Hero subscription.
StochRSI With Region Crossovers

The StochRSI with Region Crossovers shares the same values as the regular StochRSI, but it is used in a different way. There are two lines with the StochRSI: the %K and %D lines. On Cryptohopper we make an average out of the two lines The indicator has two modes: Signal on region IN (default) and Signal on region OUT.
Signal on region IN:
Instead of, for example, signaling a buy when the StochRSI is below a certain threshold (for example 30), it will only signal a buy when the StochRSI goes from below the threshold back into the neutral zone. So in our example it will send a buy signal when the indicator crosses back above 30 after being below it.
The same is true for sell signals. Instead of, for example, signaling a sell when the StochRSI is above a certain threshold (for example 70), it will only signal a sell when the StochRSI goes from above the threshold back into the neutral zone. So in our example it will send a sell signal when the indicator crosses back below 70 after being above it.
Signal on region OUT:
This setting makes it work like the regular Stochastic. It sends a buy signal when the StochRSI crosses below a certain threshold, for example 30. So if the current values is 45 and it then it crosses below 30, it will send a buy signal. This is very similar for the sell signals. A sell signal will be sent when the RSI crosses above a certain value.
StochRSI with Region Crossovers is only available for users with a Hero subscription.
Ultimate Oscillator (UO)

The Ultimate Oscillator (UO) is a momentum indicator developed in 1976 by Larry Williams. The Ultimate Oscillator combines short, medium and long-term periods to analyze the momentum of the price.
Because it uses three different time frames, the indicator is less volatile. The UO can be used in different trading styles and for various purposes. Usually, traders all around the globe use the indicator by defining overbought and oversold zones.
Overbought zones are areas where the price has risen significantly in a small interval of time, which suggests that a trend reversal can occur. Oversold zones are the opposite. They are areas where the price decreased suddenly.
The classic way of trading with the UO is to buy when the UO is oversold, and sell when it’s overbought. However, on Cryptohopper we leave a lot of room for customization. You can set the UO to send a buy/sell signal when the indicator is below, above, or even equal to a certain value. This means that you can inverse the signals to buy at overbought and sell at oversold, making it work like a trend following indicator.
It’s important to note that if you select “greater than” or “less than,” the UO will send sticking signals. This means that it will keep sending buy/sell signals as long as the UO is above or below a certain value. This feature makes the UO a great indicator to combine with others.
Tilson Moving Average (T3)

Developed by Tim Tillson, the Tilson Moving Average (T3) is a trend indicator with the advantage of having less lag than other ones. That is, a faster moving average.
The T3 moving average is an indicator of an indicator since it includes several EMAs of another EMA. Unlike any other moving average, it adds the so-called volume factor, a value between 0 and 1.
Like the SMA, traders typically use this indicator to spot trends and trend reversals. It is mainly done by crossovers between a fast and a slow moving average.
When the fast moving average crosses the slow one upwards, a buy signal is generated due to the price shows bullish signs. However, when the fast moving average crosses the slow one down the opposite happens, the bears are taking over and produces a sell signal.
Time Series Forecast (TSF)
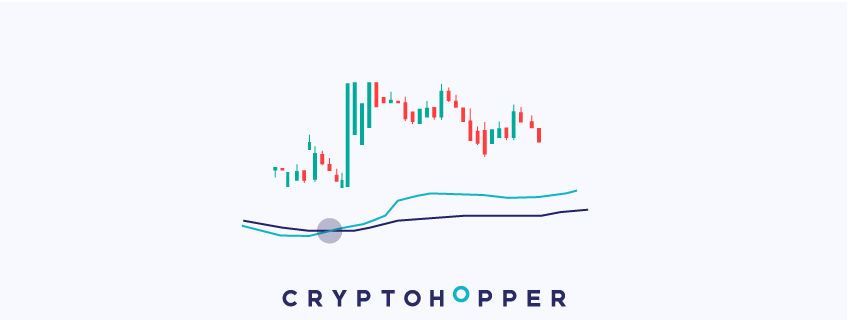
The Time Series Forecast is a trend indicator that uses a linear regression to calculate the trend of the price.
It reduces the lag of a normal moving average due to it tries to forecast the price of the next period through statistical calculations with past data.
This indicator's interpretation is identical to a moving average. It generates signals through crossovers between the Time Series Forecast line and a moving average.
When the Time Series Forecast line crosses the moving average upwards, the price is bullish and the indicator would open a position. When the opposite happens, it sends a sell signal to close the position or to open a short.
Triangular Moving Average (TMA)

The Triangular Moving Average is a trend indicator that has been averaged twice. That is, it is the simple moving average of a simple moving average.
This creates a very smooth moving average that doesn't react quickly to market volatility, therefore, filtering out the noise of the price and pinpointing the main trend of an asset.
Like a standard SMA, this indicator to spot trends and trend reversals. It is done by crossovers between a fast and a slow moving average.
In this way, when the fast moving average crosses the slow one upwards, the price can be starting a bullish trend and it generates a buy signal. When the fast moving average crosses the slow one downwards the opposite happens, the bears are in charge and it a sell or short in open.
Triple Exponential Moving Average (TEMA)

The TEMA was developed by Patrick Mulloy. It is a moving average that includes several EMAs in its calculation to smooth price fluctuations, but without the lag that characterizes trend indicators.
It is one of the fastest, and possibly the fastest, moving average available in trading. It would react quicker to price movements than any other moving average like DEMA or WMA.
The TEMA will spot entry and exit opportunities through crossovers between a fast and a slow moving average.
Therefore, when the fast moving average crosses the slow one upwards, the price is more likely to be bullish and it generates buys. When the opposite happens, the fast moving average crosses the slow one downwards, the bears are more present, which gives a sell signal.
Weighted Moving Average (WMA)

The WMA is a trend indicator. This moving average is considered as one of the fastest amongst them.
Its quick reaction to price movements is produced by assigning greater weight to the most recent periods and prices. To illustrate it, it reacts faster to price changes than the SMA and EMA. However, it is somewhat slower than the Double EMA or DEMA.
Like most of the moving averages, traders use this indicator to spot trends and trend reversals. This is done mainly by crossovers between a fast and slow moving average.
If the fast moving average crosses the slow one upwards, the price is rather bullish and buy signal will be generated. However, when the fast moving average crosses the slow one downwards, the bears are taking over and a sell signal is open.
Williams Percentage R (%R)
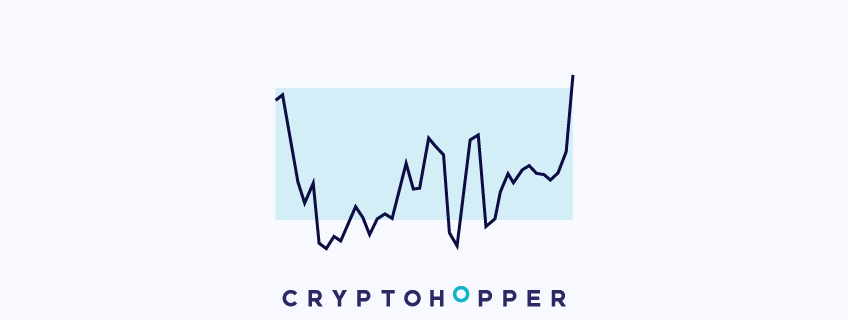
Developed by Larry Williams, the Williams %R is a momentum indicator that determines overbought and oversold zones, which oscillates between -100 and 0.
The indicator compares the highest and lowest point within a number of periods. The overbought zone is between -20 and 0, which means that the price is close to the highest point of the range. The oversold zone lies between -100 and -80, close to the lowest point of the range.
The classic way of trading with the Williams %R is to buy when the Williams %R is oversold and to sell when it is overbought. However, on Cryptohopper we leave a lot of room for customization. You can set the Williams %R to send a buy/sell signal when the indicator is below, above, or even equal to a certain value. This means that you can even inverse the signals and buy at overbought and sell at oversold, making it work like a trend following indicator.
Keep in mind that if you select “greater than” or “less than,” the Williams %R will send sticking signals. This means that it will keep sending buy/sell signals as long as the Williams %R is above or below a certain value. This feature makes the Williams %R a great indicator to combine with others.
