Candle patterns
An overview of all candlestick patterns available in Cryptohopper's Strategy Builder, with a description of what each pattern signals.
Identical Three Crows

A bearish pattern represented by three candles of similar size, each opening near the close of the prior candle and heading downwards during an uptrend. Signals a sell.
Abandoned Baby Bearish

A bearish reversal pattern represented by three candles: a long bullish candle, a Doji, and a long bearish candle. The Doji signals indecision, and the final candle confirms the bears are taking over. Signals a sell.
Abandoned Baby Bullish

A bullish reversal pattern represented by three candles: a long bearish candle, a Doji, and a long bullish candle. The Doji signals indecision, and the final candle confirms the bulls are taking over. Signals a buy.
Advance Block

A bearish reversal pattern represented by three candles with progressively shorter bodies and longer upper wicks during an uptrend. Signals increasing supply and a fading trend. Signals a sell.
Bearish Doji Star

A bearish reversal pattern represented by two candles: a long bullish candle followed by a Doji above it during an uptrend. Signals the bears are taking over. Signals a sell.
Belt-Hold Bearish

A bearish reversal pattern represented by one candle that opens at the period's high and closes near its low during an uptrend. Signals a sell.
Belt-Hold Bullish

A bullish reversal pattern represented by one candle that opens at the period's low and closes near its high during a downtrend. Signals a buy.
Breakaway Bearish

A bearish reversal pattern represented by five candles: a long bullish candle, three smaller bullish candles, and a final large bearish candle that engulfs the previous three. Signals a sell.
Breakaway Bullish

A bullish reversal pattern represented by five candles: a long bearish candle, three smaller bearish candles, and a final large bullish candle covering the previous three. Signals a buy.
Bullish Doji Star

A bullish reversal pattern represented by two candles: a long bearish candle followed by a Doji below it during a downtrend. Signals the bulls are taking over. Signals a buy.
Closing Marubozu Bearish

A bearish continuation pattern represented by one long decreasing candle with no lower wick. Indicates a peak in supply driving the price down. Signals a sell.
Closing Marubozu Bullish

A bullish continuation pattern represented by one long increasing candle with no upper wick. Indicates a peak in demand driving the price up. Signals a buy.
Concealing Baby Swallow

A bullish reversal pattern represented by four candles. Two bearish Marubozus are followed by a candle that eats into the prior body, then a large bullish candle that fully engulfs the third. Signals a buy.
Counterattack Bearish

A bearish reversal pattern represented by two candles: a long bullish candle followed by a bearish candle that closes near the first candle's close. Signals the bears are strongly rejecting the uptrend. Signals a sell.
Counterattack Bullish

A bullish reversal pattern represented by two candles: a long bearish candle followed by a bullish candle that closes near the first candle's close. Signals the bulls are strongly rejecting the downtrend. Signals a buy.
Dark Cloud Cover

A bearish reversal pattern represented by one candle that makes a new high but closes below the midpoint of the previous candle. Signals a sell.
Down-Gap Side-By-Side White Lines Bearish

A bearish continuation pattern represented by three candles. During a downtrend, a gap forms between the first and second candle, and the third continues decreasing. Signals a sell.
Downside Gap Three Methods Bullish

A bullish reversal pattern represented by three candles. Two decreasing candles feature a gap, then a long bullish candle closes the gap and initiates an uptrend. Signals a buy.
Downside Tasuki Gap

A bearish continuation pattern represented by three candles. Two bearish candles create a gap, then a third bullish candle closes within the gap. Despite the pullback, the bearish trend is likely to continue. Signals a buy.
Dragonfly Doji

A bearish reversal pattern represented by one candle with a long lower wick and no upper wick. Found during uptrends, it signals indecision with a bearish lean. Signals a sell.
Engulfing Bearish

A bearish reversal pattern represented by two candles. A large bearish candle fully engulfs the previous bullish candle during an uptrend. Signals a sell.
Engulfing Bullish

A bullish reversal pattern represented by two candles. A large bullish candle fully engulfs the previous bearish candle during a downtrend. Signals a buy.
Evening Doji Star

A bearish reversal pattern represented by three candles: a long bullish candle, a Doji at the top, and a long bearish candle closing below the midpoint of the first. Signals a sell.
Evening Star

A bearish reversal pattern represented by three candles: a long bullish candle, a small-bodied candle, and a long bearish candle closing below the midpoint of the first. Signals a sell.
Falling Three Methods
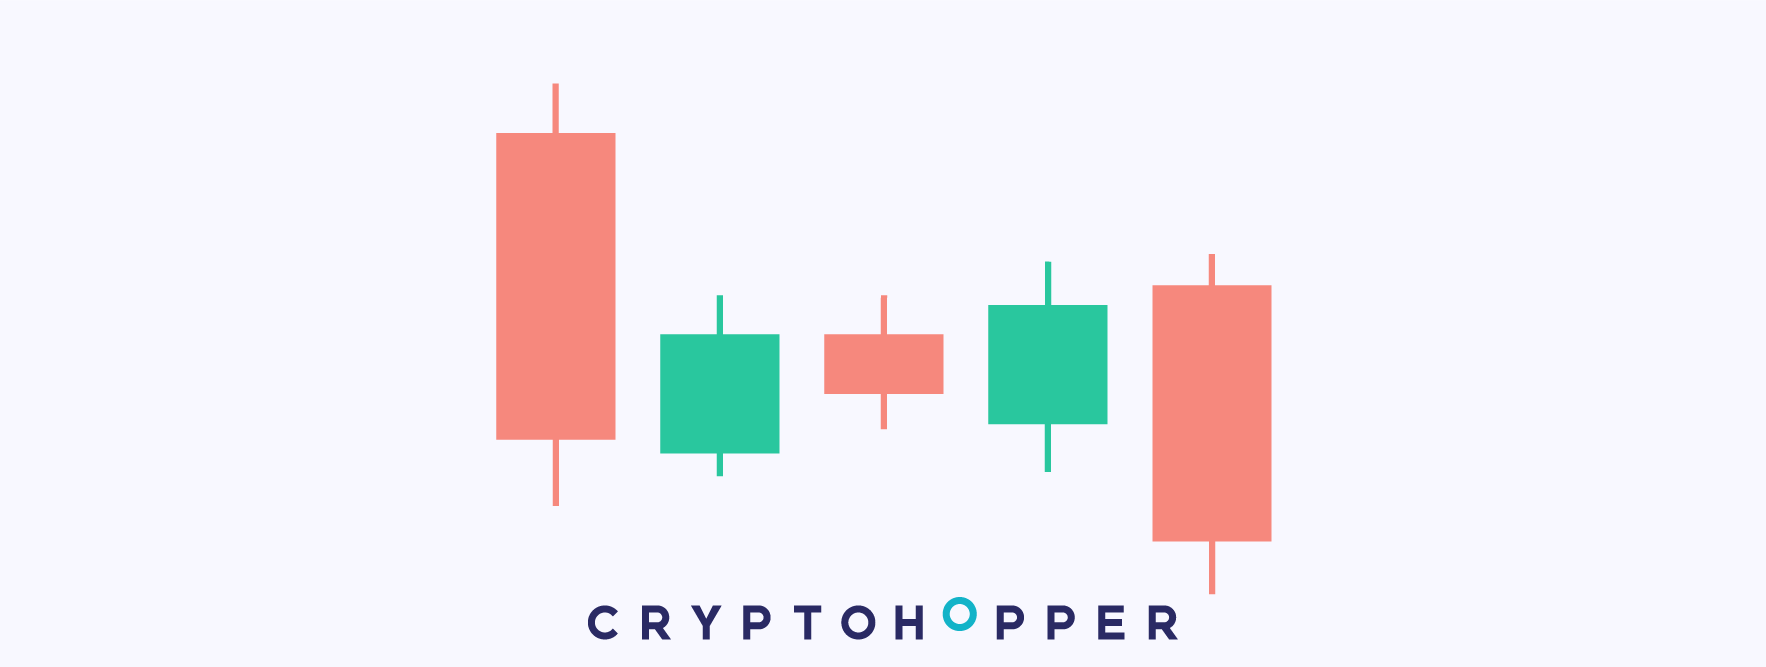
A bearish continuation pattern represented by five candles: a long bearish candle, three small bullish candles as a pullback, and a final long bearish candle making a new low. Signals a sell.
Gravestone Doji

A bearish reversal pattern represented by one candle with a long upper wick and open/close near the low. Indicates strong bearish presence. Signals a sell.
Hammer

A bullish reversal pattern represented by one candle with a short body at the top and a long lower wick. Found during downtrends, it indicates strong demand rejection of lower prices. Signals a buy.
Hanging Man

A bearish reversal pattern represented by one candle with a long lower wick and short body at the top. Found during uptrends, it signals trend weakness. Signals a sell.
Harami Bearish
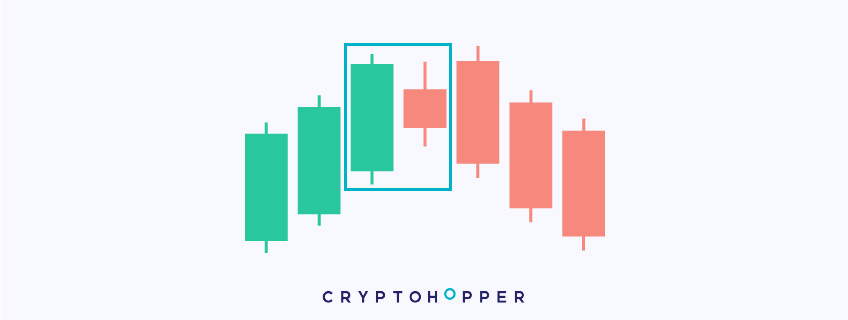
A bearish reversal pattern represented by two candles: a long bullish candle followed by a small bearish candle within the range of the first. Shows weakening uptrend momentum. Signals a sell.
Harami Bullish
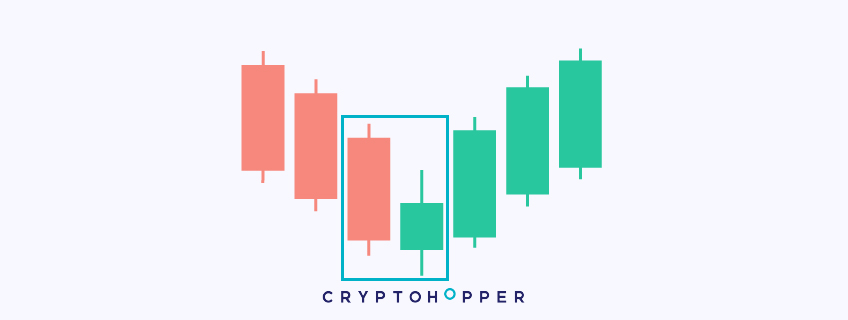
A bullish reversal pattern represented by two candles: a long bearish candle followed by a small bullish candle within the range of the first. Shows weakening downtrend momentum. Signals a buy.
Harami Cross Bearish

A bearish reversal pattern similar to the Harami Bearish, but the second candle is a Doji instead of a small-bodied candle. Shows weakening uptrend momentum. Signals a sell.
Harami Cross Bullish

A bullish reversal pattern similar to the Harami Bullish, but the second candle is a Doji. Shows weakening downtrend momentum. Signals a buy.
High-Wave Bearish

A bearish pattern represented by one candle with a small body, long wicks, and a close below its open. Indicates market indecision with a bearish lean. Signals a sell.
High-Wave Bullish

A bullish pattern represented by one candle with a small body, long wicks, and a close above its open. Indicates market indecision with a bullish lean. Signals a buy.
Hikkake Bearish
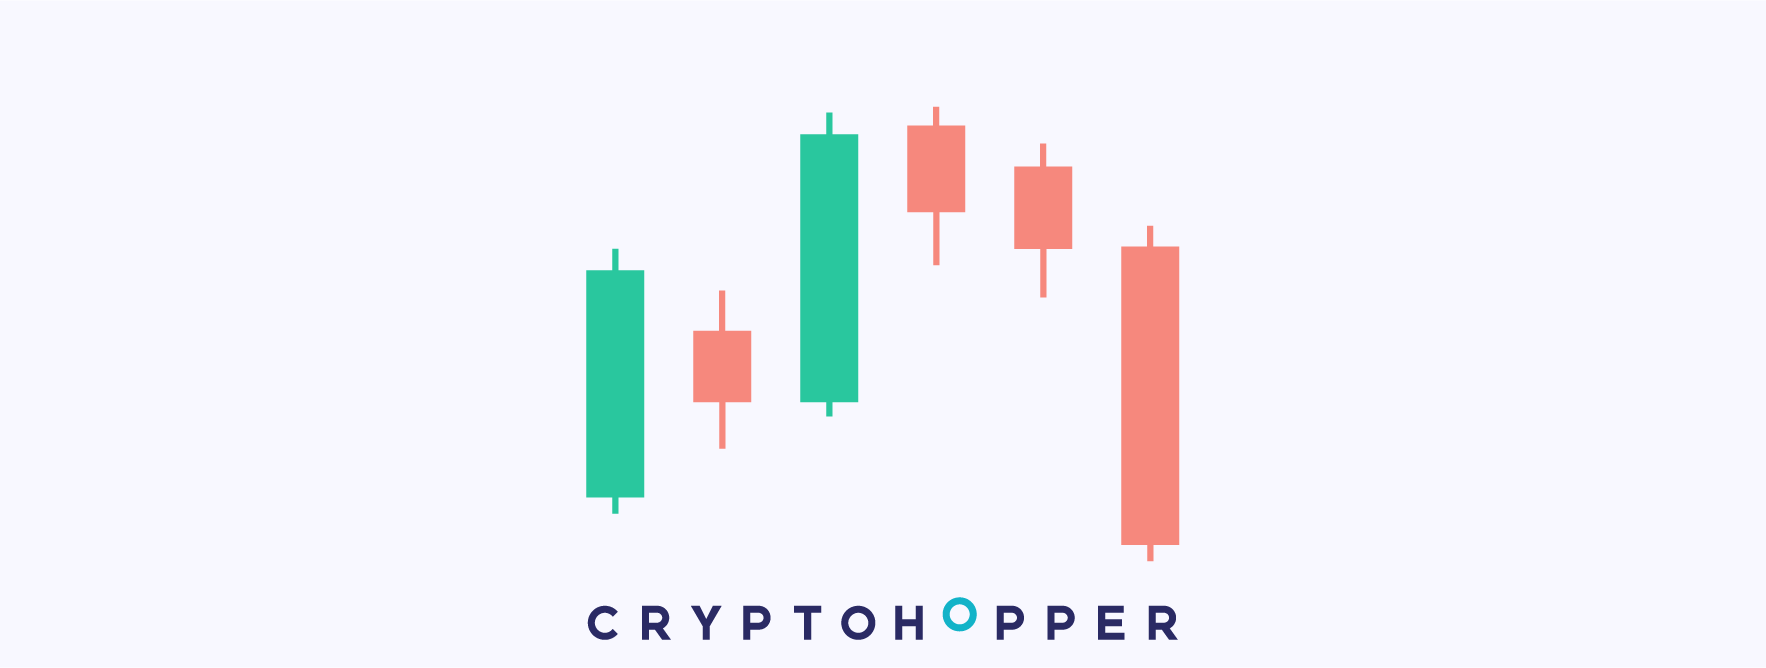
A bearish pattern represented by at least three candles: a long bullish candle, a smaller candle engulfed by the first, and a third that breaks the first candle's low. Signals a sell.
Hikkake Bullish

A bullish pattern represented by at least three candles: a long bearish candle, a smaller candle engulfed by the first, and a third that breaks the first candle's high. Signals a buy.
Homing Pigeon Bearish

A bearish pattern represented by two candles during an uptrend: a long bullish candle followed by a smaller bullish candle within its range. Indicates the trend is fading. Signals a sell.
Homing Pigeon Bullish

A bullish pattern represented by two candles during a downtrend: a long bearish candle followed by a smaller bearish candle within its range. Indicates the trend is fading. Signals a buy.
In-Neck

A bearish continuation pattern represented by two candles: a long bearish candle followed by a small bullish candle that closes slightly above the prior close. The bulls are too weak to stop the downtrend. Signals a sell.
Inverted Hammer

A bearish reversal pattern represented by one candle with a long upper wick and short body at the bottom, found during uptrends. Indicates strong supply rejection of higher prices. Signals a sell.
Kicking Bearish

A bearish pattern represented by two Marubozu candles: a long bullish candle followed by a long bearish candle with a gap. A strong signal that the market is heading down. Signals a sell.
Kicking Bullish

A bullish pattern represented by two Marubozu candles: a long bearish candle followed by a long bullish candle with a gap. A strong signal that the market is heading up. Signals a buy.
Ladder Bottom

A bullish reversal pattern represented by five candles: three long bearish candles, an Inverted Hammer, and a final long bullish candle. The fifth candle kicks off a new uptrend. Signals a buy.
Ladder Top

A bearish reversal pattern represented by five candles: three long bullish candles, a Hammer-shaped candle, and a final long bearish candle. The fifth candle kicks off a new downtrend. Signals a sell.
Long Line Bearish
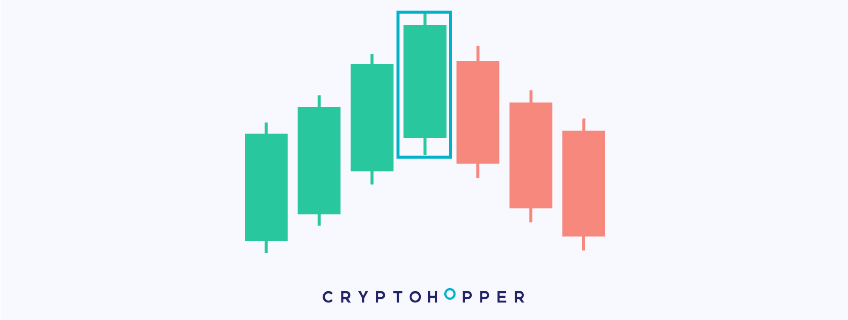
A bearish continuation pattern represented by one long bearish candle similar to a Marubozu, indicating strong selling pressure during a downtrend. Signals a sell.
Long Line Bullish
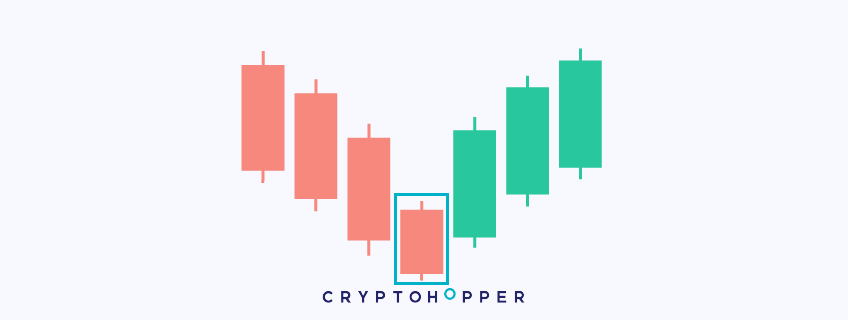
A bullish continuation pattern represented by one long bullish candle similar to a Marubozu, indicating strong buying pressure during an uptrend. Signals a buy.
Marubozu Bearish

A bearish pattern represented by one long bearish candle with short or no wicks. The bears are aggressively driving the price down. Signals a sell.
Marubozu Bullish

A bullish pattern represented by one long bullish candle with short or no wicks. The bulls are aggressively driving the price up. Signals a buy.
Mat Hold Bearish

A bearish continuation pattern represented by five candles: a long bearish candle, three small bullish candles as a pullback, and a final long bearish candle making a new low. Signals a sell.
Mat Hold Bullish

A bullish continuation pattern represented by five candles: a long bullish candle, three small bearish candles as a pullback, and a final long bullish candle making a new high. Signals a buy.
Matching Low

A bullish reversal pattern represented by two candles during a downtrend: a long bearish candle followed by a smaller candle that closes at the same level, creating a support. The downtrend may be ending. Signals a buy.
Modified Hikkake Bearish

A bearish continuation pattern represented by three candles: a long bearish candle, a candle that looks like a reversal (the trap), and a final bearish candle making a new low. Signals a sell.
Modified Hikkake Bullish

A bullish continuation pattern represented by three candles: a long bullish candle, a candle that looks like a reversal (the trap), and a final bullish candle making a new high. Signals a buy.
Morning Doji Star

A bullish reversal pattern represented by three candles: a long bearish candle, a Doji below it, and a long bullish candle closing above the midpoint of the first. Signals a buy.
Morning Star

A bullish reversal pattern represented by three candles: a long bearish candle, a small-bodied candle (the star), and a long bullish candle closing above the midpoint of the first. Signals a buy.
On-Neck

A bearish continuation pattern represented by two candles: a long bearish candle followed by a small bullish candle that closes near the prior low. The bulls are too weak to reverse the trend. Signals a sell.
Piercing

A bullish reversal pattern represented by two candles: a long bearish candle followed by a bullish candle that closes above the midpoint of the first. Signals a buy.
Rickshaw Man

A Doji with long upper and lower wicks, representing high indecision in the market. Recommended to use in combination with other indicators to determine direction.
Rising Three Methods

A bullish continuation pattern represented by five candles: a long bullish candle, three small bearish candles as a pullback, and a final long bullish candle making a new high. Signals a buy.
Separating Lines Bearish

A bearish continuation pattern represented by two candles: a long bullish candle followed by a long bearish candle that opens at the same price as the prior open and makes a new low. Signals a sell.
Separating Lines Bullish

A bullish continuation pattern represented by two candles: a long bearish candle followed by a long bullish candle that opens at the same price as the prior open and makes a new high. Signals a buy.
Shooting Star

A bearish reversal pattern represented by one candle with a small body and long upper wick, found during uptrends. Indicates heavy bearish rejection of higher prices. Signals a sell.
Short Line Bearish

A bearish pattern represented by one small red candle with medium-sized wicks. Found in trending and ranging markets, it anticipates price decreases. Signals a sell.
Short Line Bullish

A bullish pattern represented by one small green candle with medium-sized wicks. Found in trending and ranging markets, it anticipates price increases. Signals a buy.
Spinning Top Bearish

A bearish indecision pattern represented by one candle with a short body, long wicks on both sides, and a close below its open. Used to detect weakening uptrends. Signals a sell.
Spinning Top Bullish

A bullish indecision pattern represented by one candle with a short body, long wicks on both sides, and a close above its open. Used to detect weakening downtrends. Signals a buy.
Stalled Pattern Bearish

A bearish pattern represented by three candles during an uptrend: each candle has a shorter body, and the last fails to break the prior high — creating a resistance. Signals a sell.
Stalled Pattern Bullish

A bullish pattern represented by three candles during a downtrend: each candle has a shorter body, and the last fails to break the prior low — creating a support. Signals a buy.
Stick Sandwich Bearish

A bearish reversal pattern represented by three candles during an uptrend: a bullish candle, a bearish candle closing below the prior low, and another bullish candle that fails to make a new high — creating a resistance. Signals a sell.
Stick Sandwich Bullish

A bullish reversal pattern represented by three candles during a downtrend: a bearish candle, a bullish candle closing above the prior high, and another bearish candle that fails to make a new low — creating a support. Signals a buy.
Takuri Line

A bullish pattern represented by one candle with a short body and long lower wick, similar to a Hammer. Indicates strong demand rejection of lower prices. Signals a buy.
Three Advancing White Soldiers

A bullish reversal pattern represented by three long bullish candles after a downtrend. Indicates aggressive bullish reaction to prior declines. Signals a buy.
Three Black Crows

A bearish reversal pattern represented by three long bearish candles after an uptrend. Indicates aggressive bearish reaction to prior increases. Signals a sell.
Three Inside Up/Down Bearish

A bearish reversal pattern represented by three candles: a long bullish candle, a small bearish candle within its range, and a long bearish candle closing below the first. Signals a sell.
Three Inside Up/Down Bullish

A bullish reversal pattern represented by three candles: a long bearish candle, a small bullish candle within its range, and a long bullish candle closing above the first. Signals a buy.
Three Stars In The South

A bullish reversal pattern represented by three candles during a downtrend, each with a progressively shorter body and each engulfed by the first. Indicates fading bearish momentum. Signals a buy.
Three-Line Strike Bearish

A bearish continuation pattern represented by four candles: three small bullish candles as a pullback, followed by a large bearish candle that engulfs all three and continues the downtrend. Signals a sell.
Three-Line Strike Bullish

A bullish continuation pattern represented by four candles: three small bearish candles as a pullback, followed by a large bullish candle that engulfs all three and continues the uptrend. Signals a buy.
Tri-Star Bearish

A bearish pattern represented by three Doji candles during an uptrend. The last Doji suggests the start of a bearish movement. Signals a sell.
Tri-Star Bullish

A bullish pattern represented by three Doji candles during a downtrend. The last Doji suggests the start of a bullish movement. Signals a buy.
Two Crows

A bearish reversal pattern represented by three candles during an uptrend: a bullish candle followed by two decreasing candles. A small gap forms and is quickly closed by bearish pressure. Signals a sell.
Unique Three River

A bullish reversal pattern represented by three candles: a long bearish candle, a red hammer with a long lower wick, and a small bullish candle. The hammer suggests a demand zone has been reached. Signals a buy.
Up-Gap Side-By-Side White Lines Bullish

A bullish continuation pattern represented by three candles. During an uptrend, a gap forms between the first and second candle, and the third continues increasing. Signals a buy.