Un ejemplo de una Estrategia construida con el Constructor de Estrategias
Este artículo muestra un ejemplo de una Estrategia creada con el Constructor de Estrategias.
Este es solo un ejemplo. Siempre haz tu propia investigación antes de construir e implementar una estrategia.
Ejemplo de Estrategia
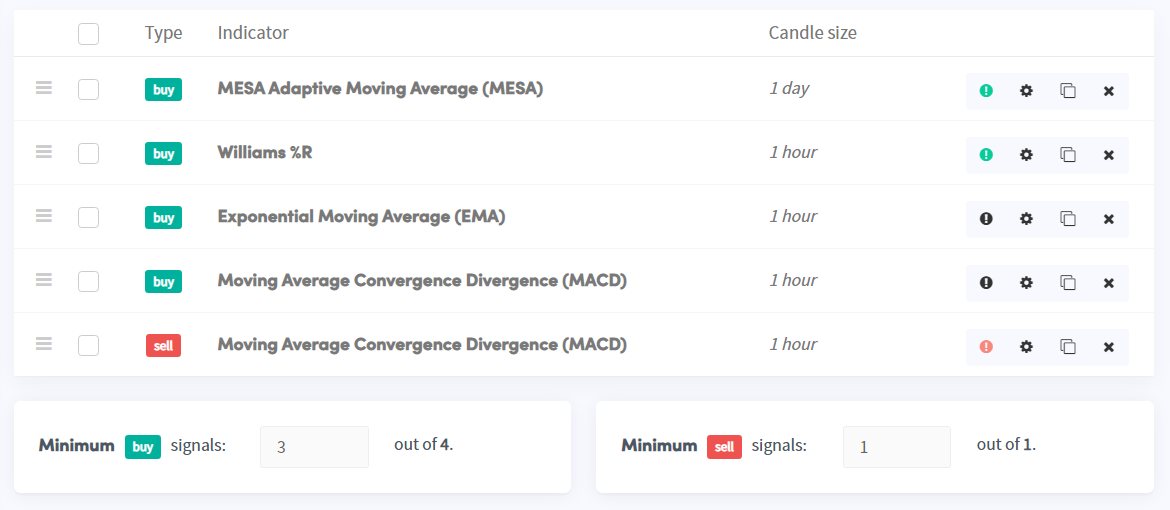
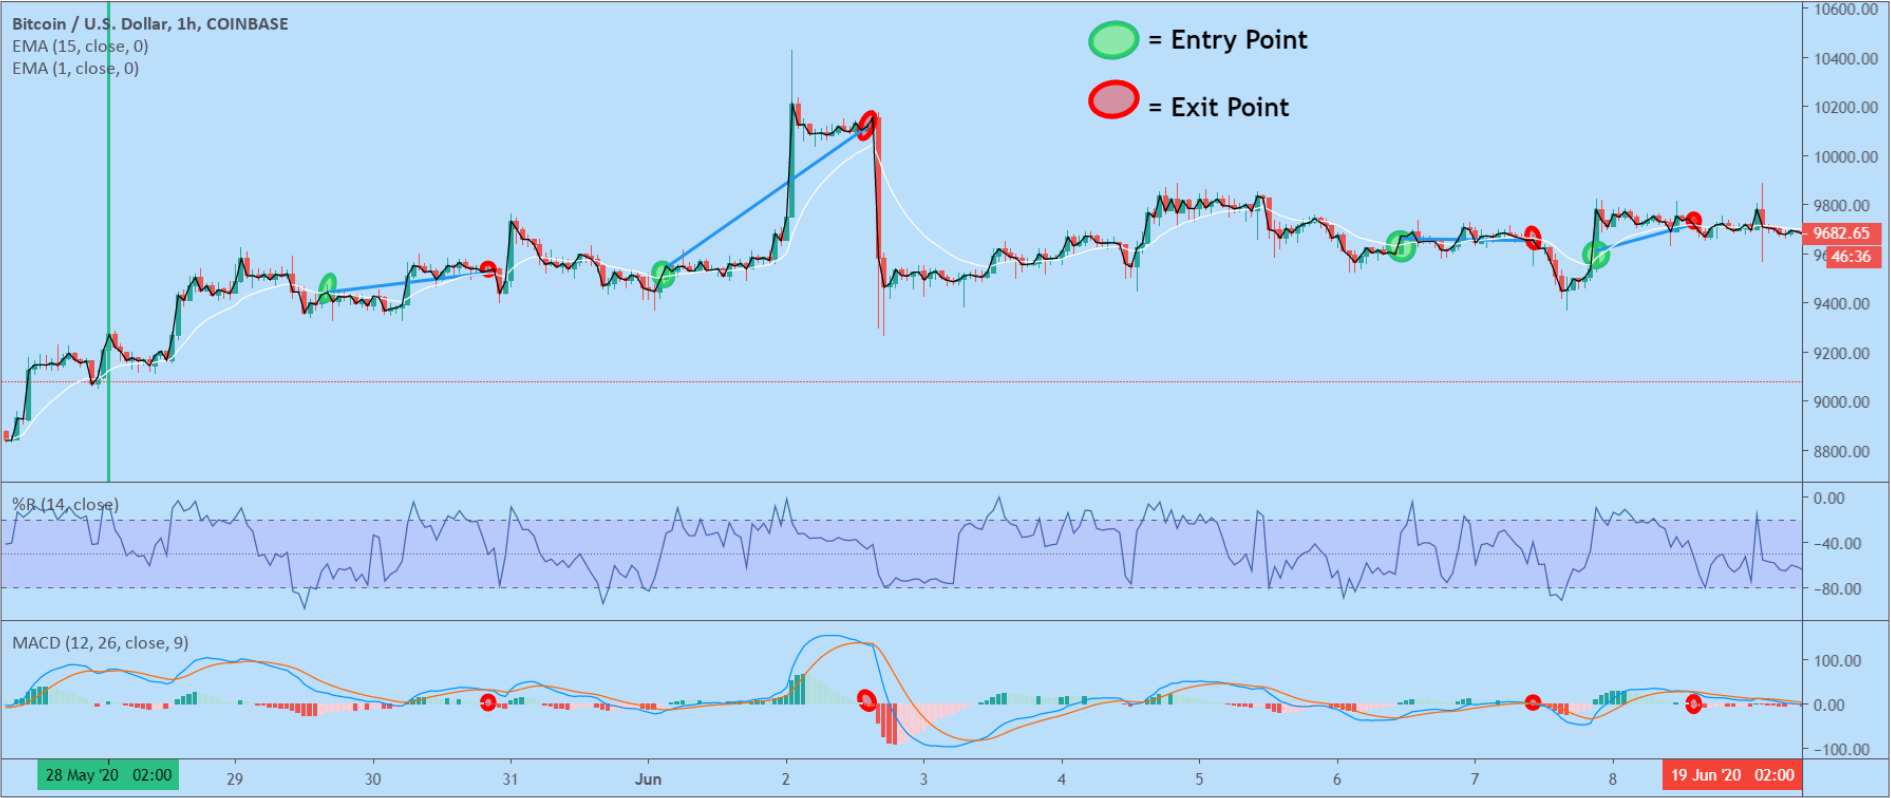
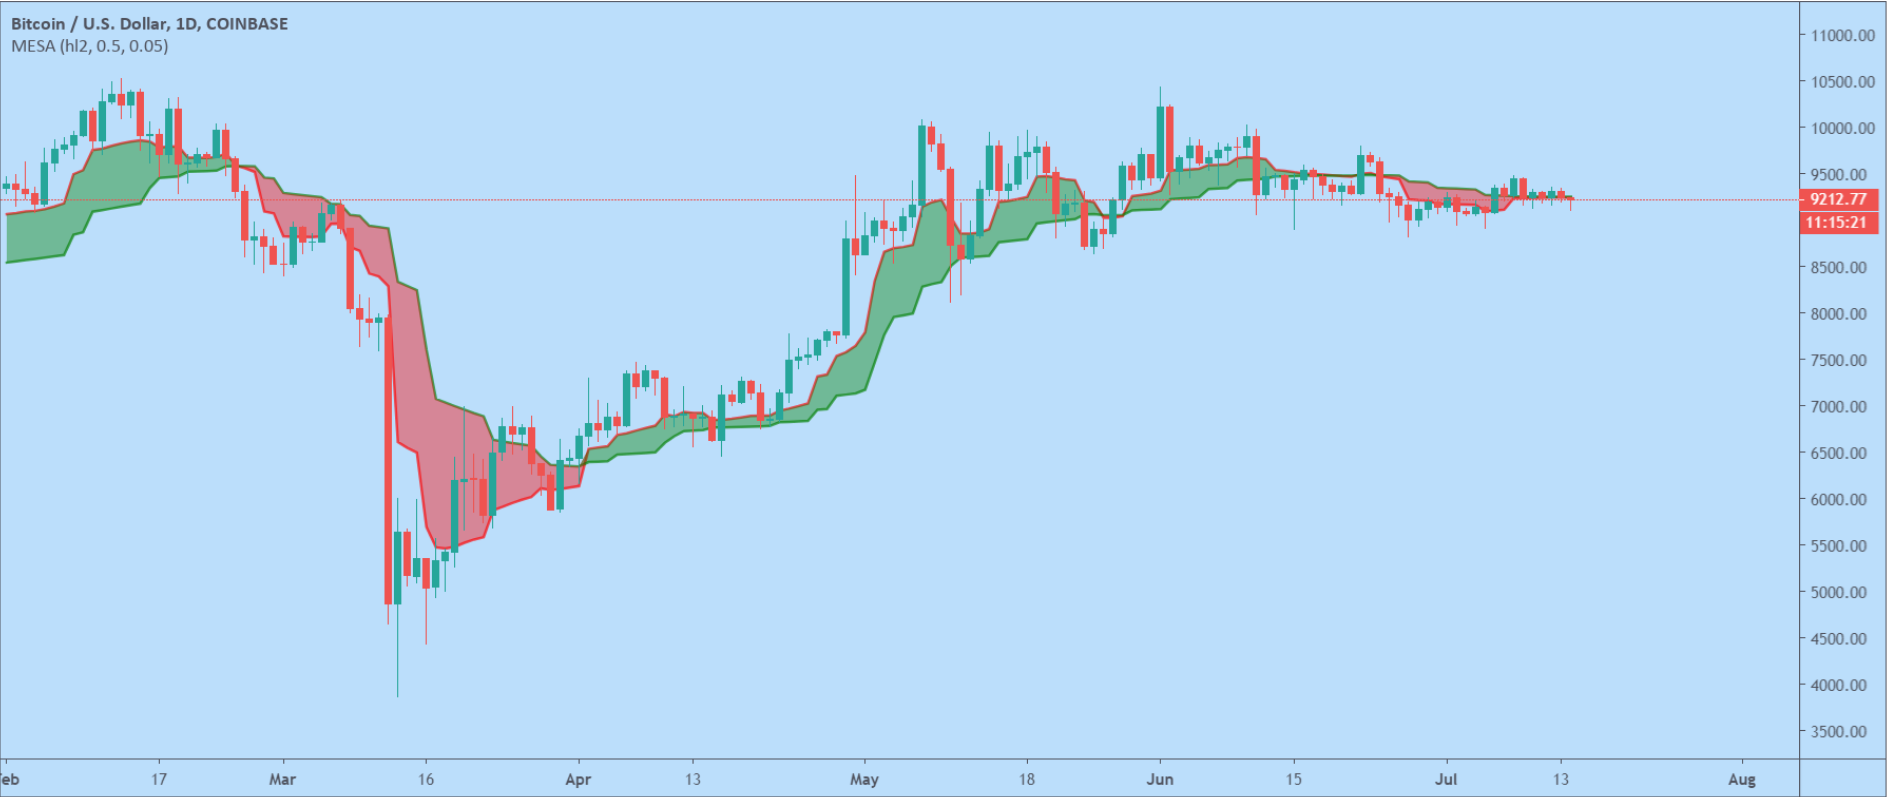
En este ejemplo, construimos una estrategia usando tres indicadores: MESA para identificar la tendencia más amplia, William's %R para encontrar puntos de compra, y EMA para confirmar la dirección de la tendencia. Luego se agrega un indicador de venta MACD para cerrar posiciones.
Paso 1 — MESA (gráfico diario, señal de compra)
Usamos el MESA en el gráfico diario para identificar un mercado alcista. El MESA indica un mercado alcista mientras la nube sea verde.
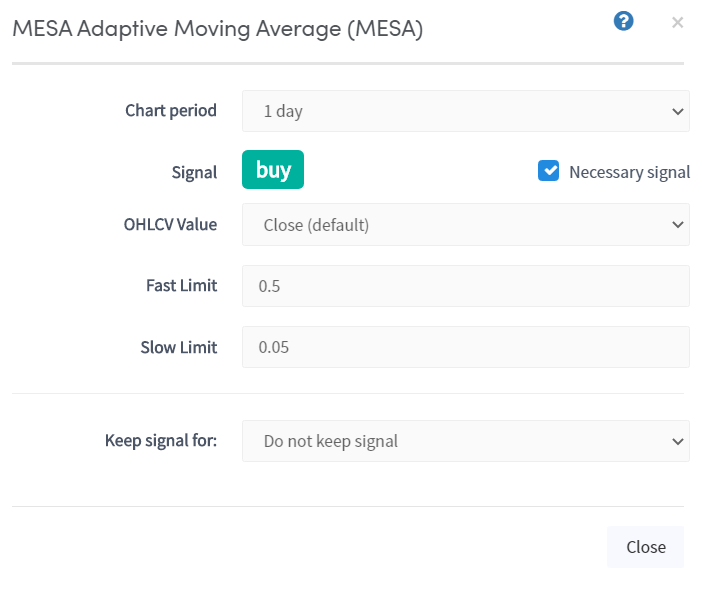
Ajustes usados en este ejemplo:
Período del gráfico: 1 día Señal: Compra Valor OHLCV: Cierre (predeterminado) Límite rápido: 0.5 (predeterminado) Límite lento: 0.05 (predeterminado) Mantener señal por: No es necesario para este indicador Señal necesaria: Sí — el MESA siempre debe ser alcista para entrar en un trading
Paso 2 — William's %R (gráfico de 1 hora, señal de compra)
William's %R identifica un suelo cada vez que la línea cae por debajo de -80. Puede encontrar excelentes puntos de compra en un mercado alcista, pero tiene una desventaja: en un mercado en caída señala compras continuamente. Lo combinamos con el MESA y EMA para filtrar las malas señales.
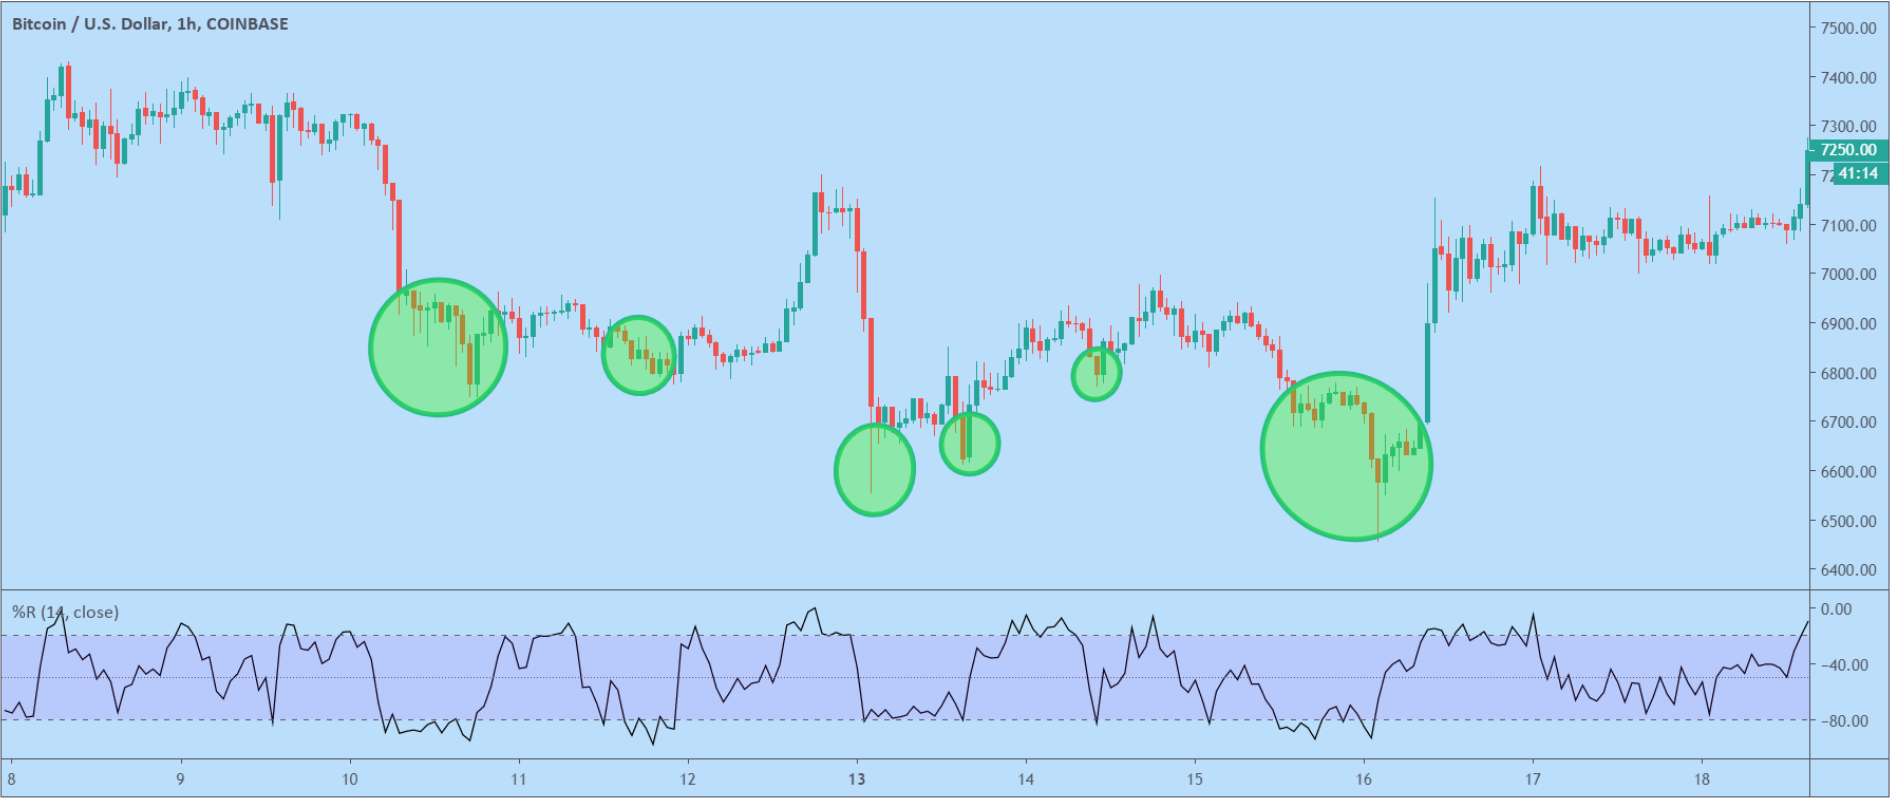
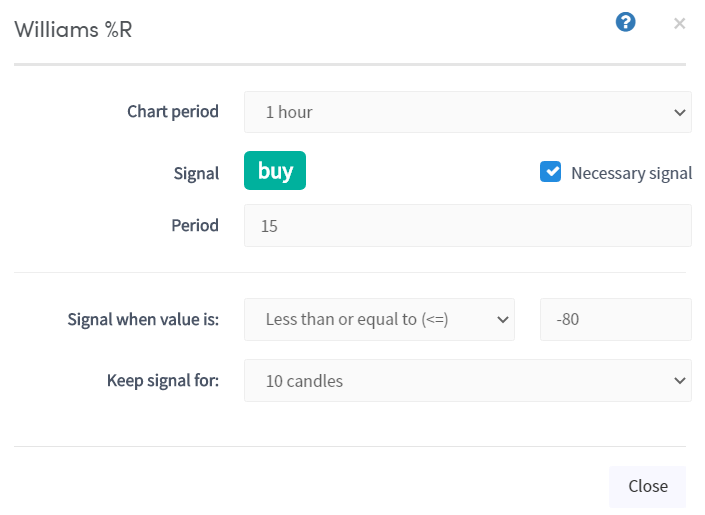
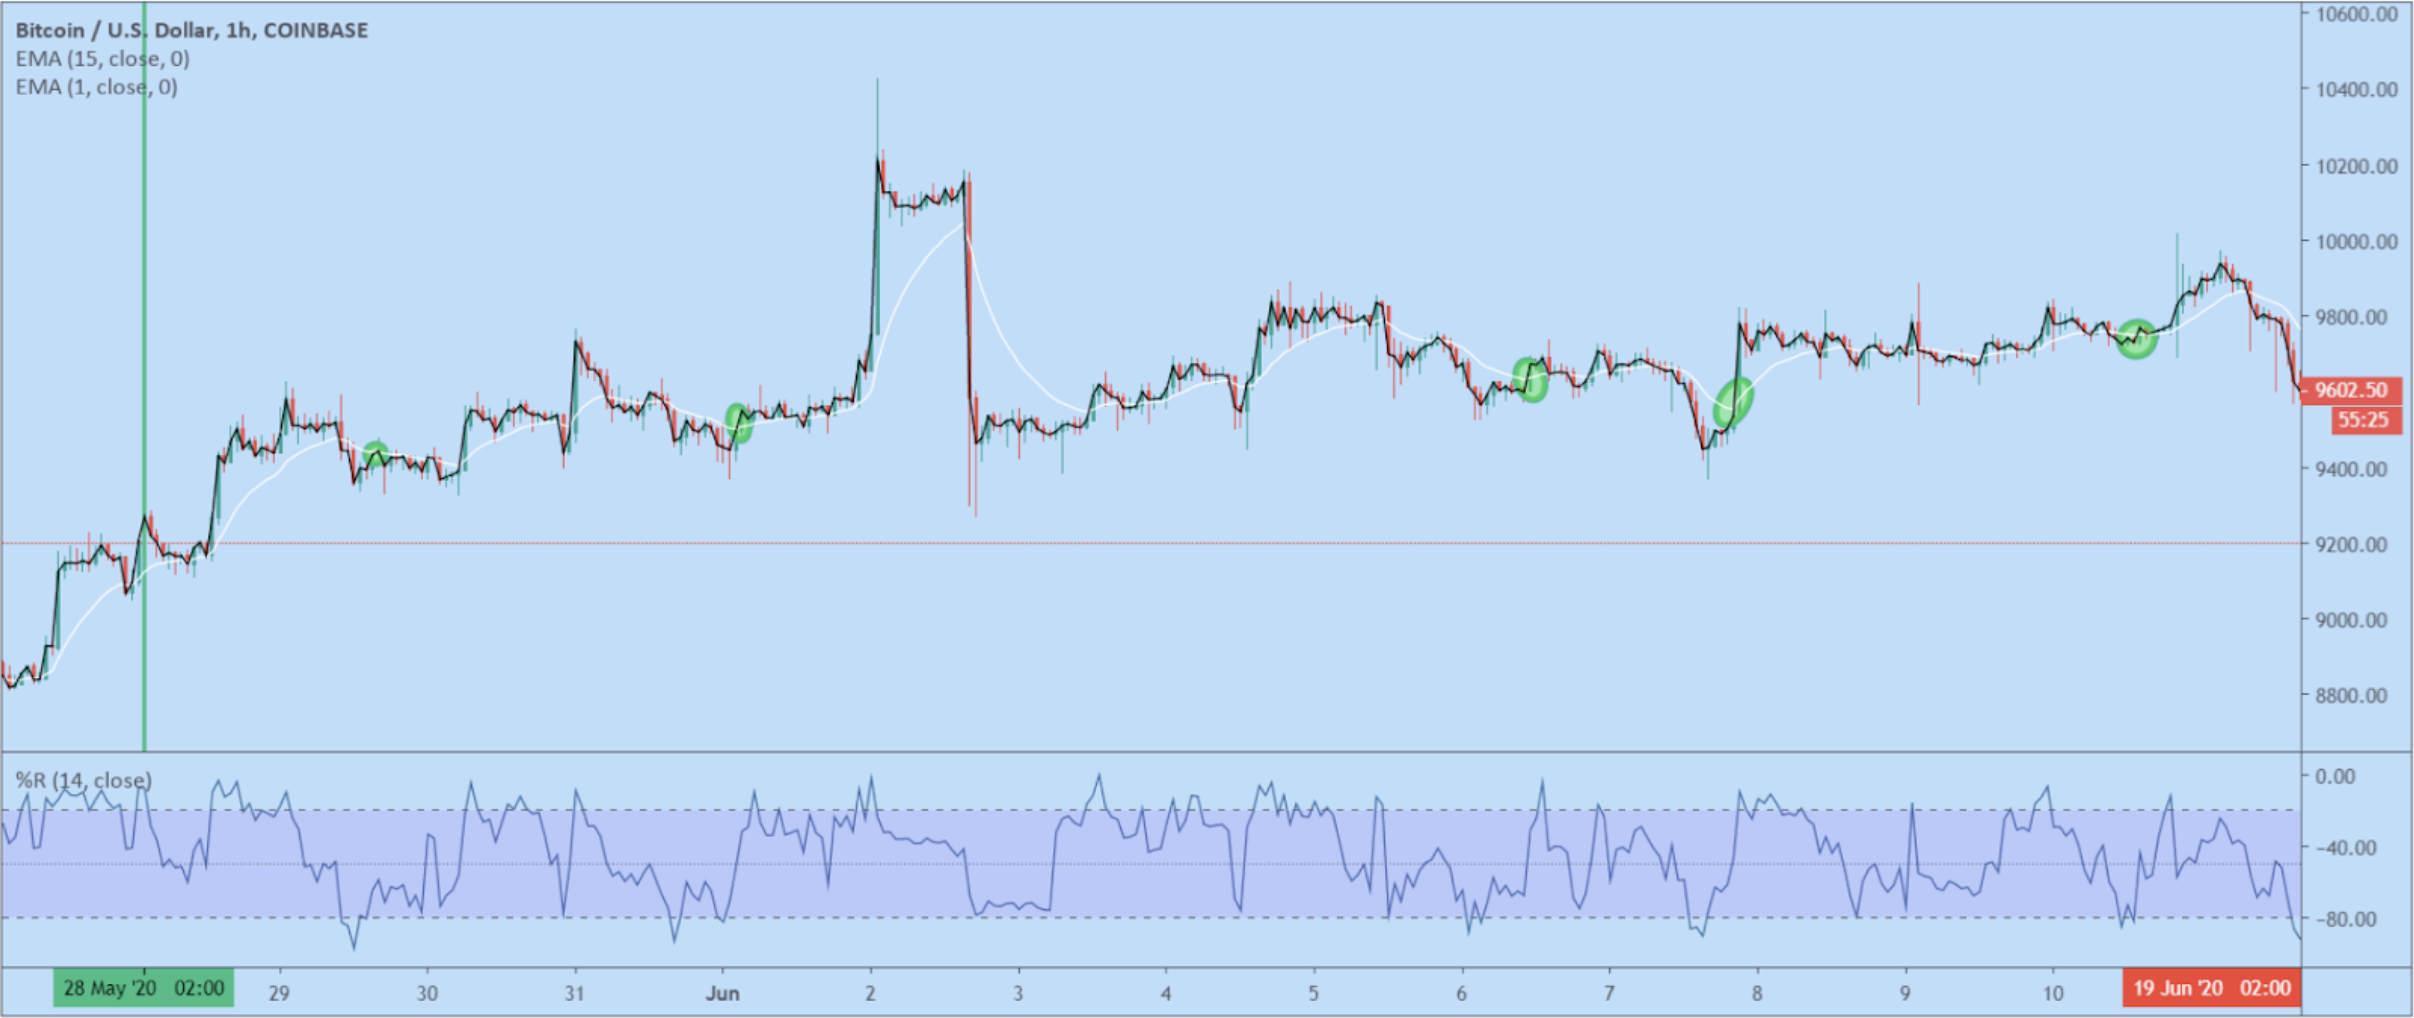
Configuramos William's %R para mantener su señal durante 10 velas. Es raro que William's %R esté sobrevendido al mismo tiempo que el cruce EMA señale alcista — así que mantener la señal durante 10 velas permite que los indicadores se alineen.
Paso 3 — Cruce EMA (señal de compra)
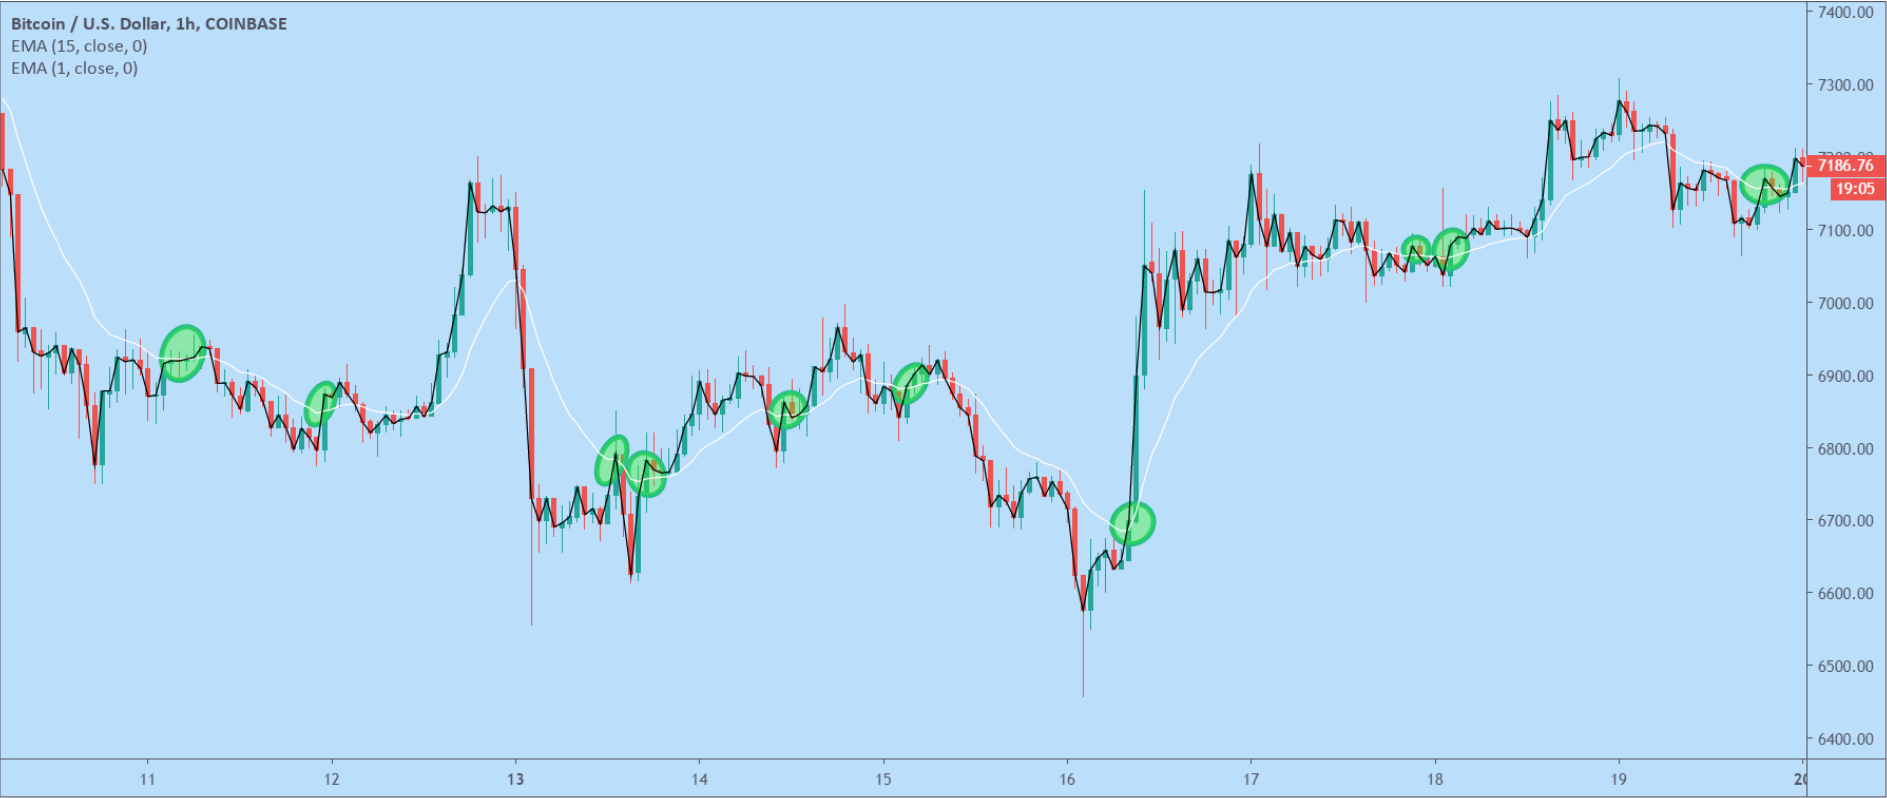
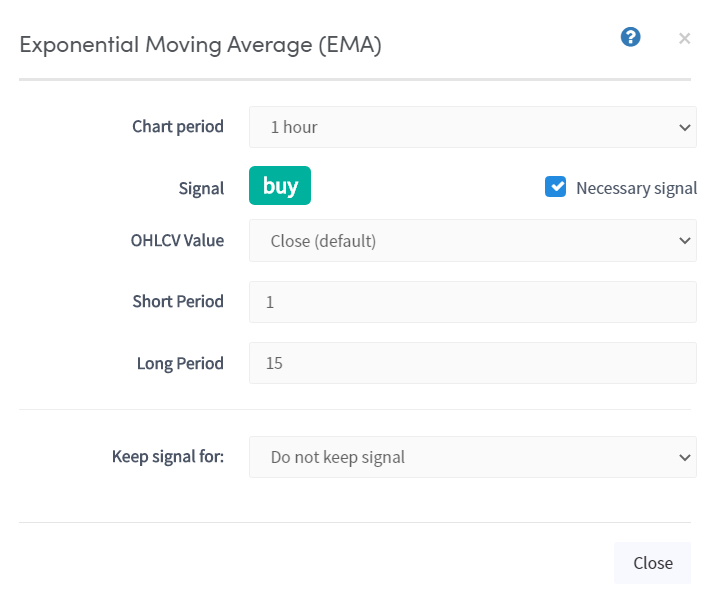
Un cruce del EMA de 1 y 15 confirma cuando la tendencia se vuelve alcista de nuevo. Se genera una señal de compra cada vez que el EMA rápido cruza por encima del EMA lento.
Paso 4 — Señales mínimas de compra
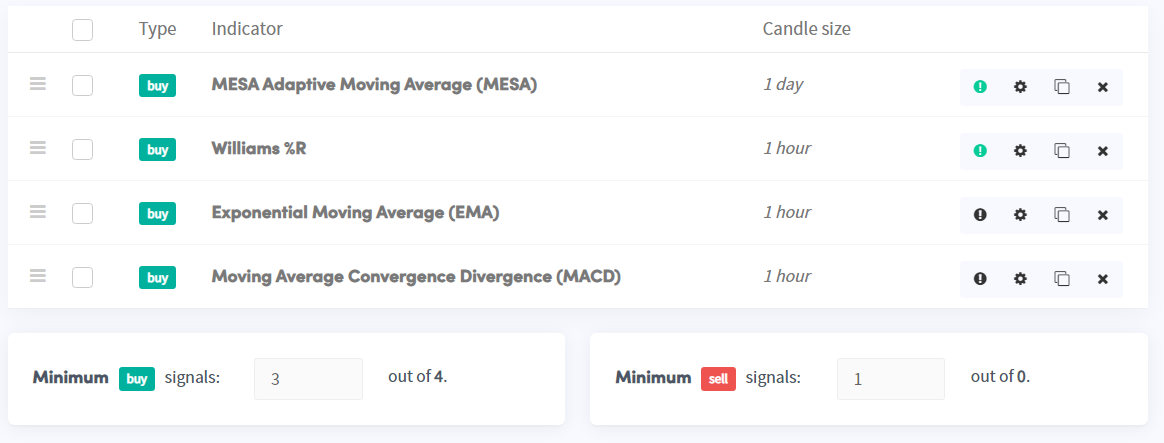
Configuramos las señales mínimas de compra a 3 de 3 — lo que significa que los tres indicadores deben señalar una compra simultáneamente antes de que el bot abra una posición.

Este ajuste es flexible. Por ejemplo, si agregas un MACD como sustituto del EMA, podrías configurar el mínimo a 3 de 4. El MESA y el William's %R siguen siendo necesarios, mientras que el EMA o el MACD pueden satisfacer el tercer requisito.
Paso 5 — Indicador de venta MACD (gráfico de 1 hora)
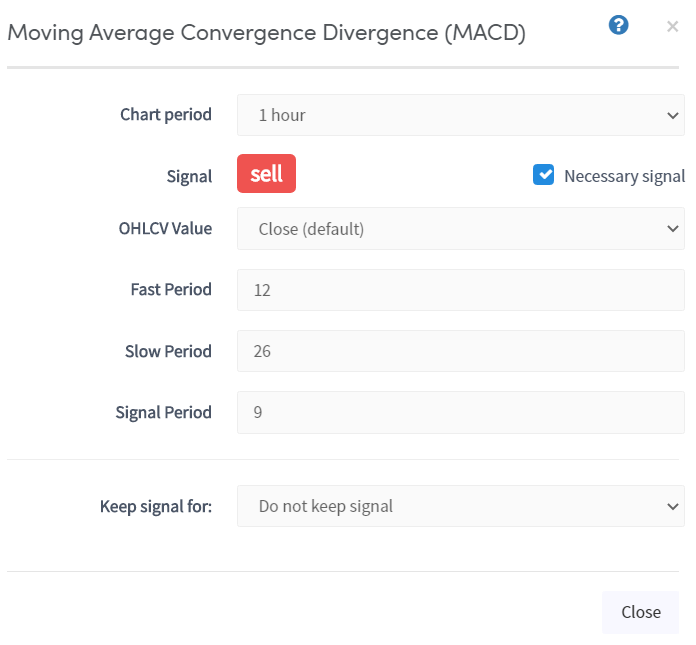
Para cerrar posiciones, agregamos un indicador de venta MACD en el gráfico horario. Para configurar un indicador como señal de venta, haz clic en el botón verde "compra" en el menú del indicador para alternarlo a "venta".
Estrategia final