Indicadores técnicos
Este artículo muestra todos los indicadores técnicos disponibles en Cryptohopper. Estos indicadores se pueden dividir en cuatro tipos diferentes. Lee más sobre los diferentes tipos aquí.
Oscilador de Precio Absoluto (APO)
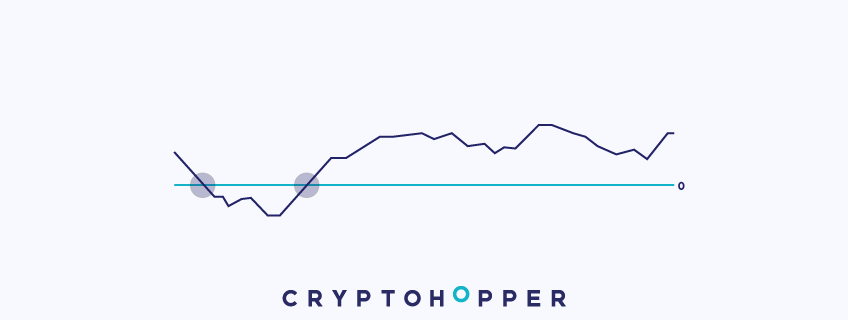
El APO es esencialmente una estrategia de cruce de medias móviles mostrada como una línea que oscila alrededor de cero. Cuando la media móvil más corta cruza por encima de la más larga, la línea cruza por encima de 0 y genera una señal de compra. Cuando la más corta cruza por debajo de la más larga, la línea cae por debajo de 0 y genera una señal de venta. En Cryptohopper puedes combinar diferentes tipos de medias móviles — por ejemplo, una Media Móvil Simple con una Media Móvil Exponencial.
Aroon
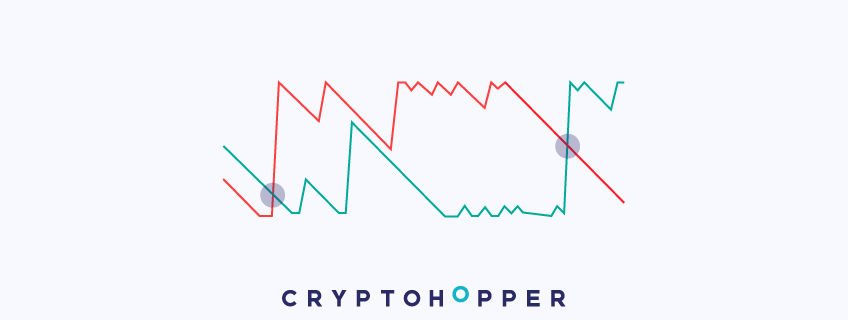
Aroon es un oscilador de momentum también usado para detectar tendencias. Tiene dos líneas — Aroon Arriba y Aroon Abajo — que fluctúan entre 0 y 100. Aroon Arriba mide la frecuencia de nuevos máximos; Aroon Abajo mide nuevos mínimos. Se genera una señal de compra cuando Aroon Arriba cruza por encima de Aroon Abajo; una señal de venta cuando Aroon Abajo cruza por encima de Aroon Arriba.
Oscilador Aroon
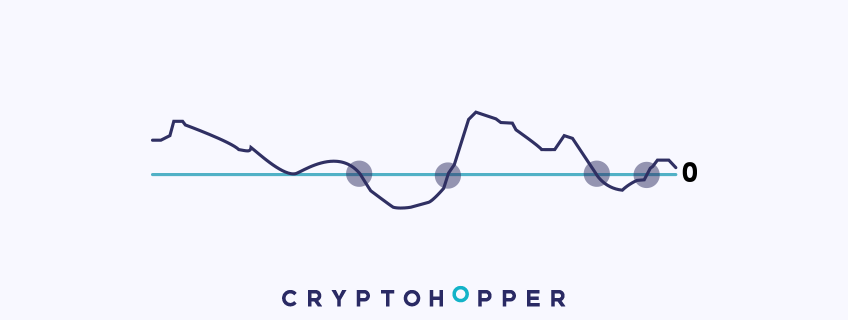
El Oscilador Aroon calcula la diferencia entre Aroon Arriba y Aroon Abajo, representado en una escala de -100 a +100. Funciona de manera idéntica al Aroon regular y proporciona las mismas señales de compra/venta — la única diferencia es visual.
Movimiento Direccional Promedio (ADX)
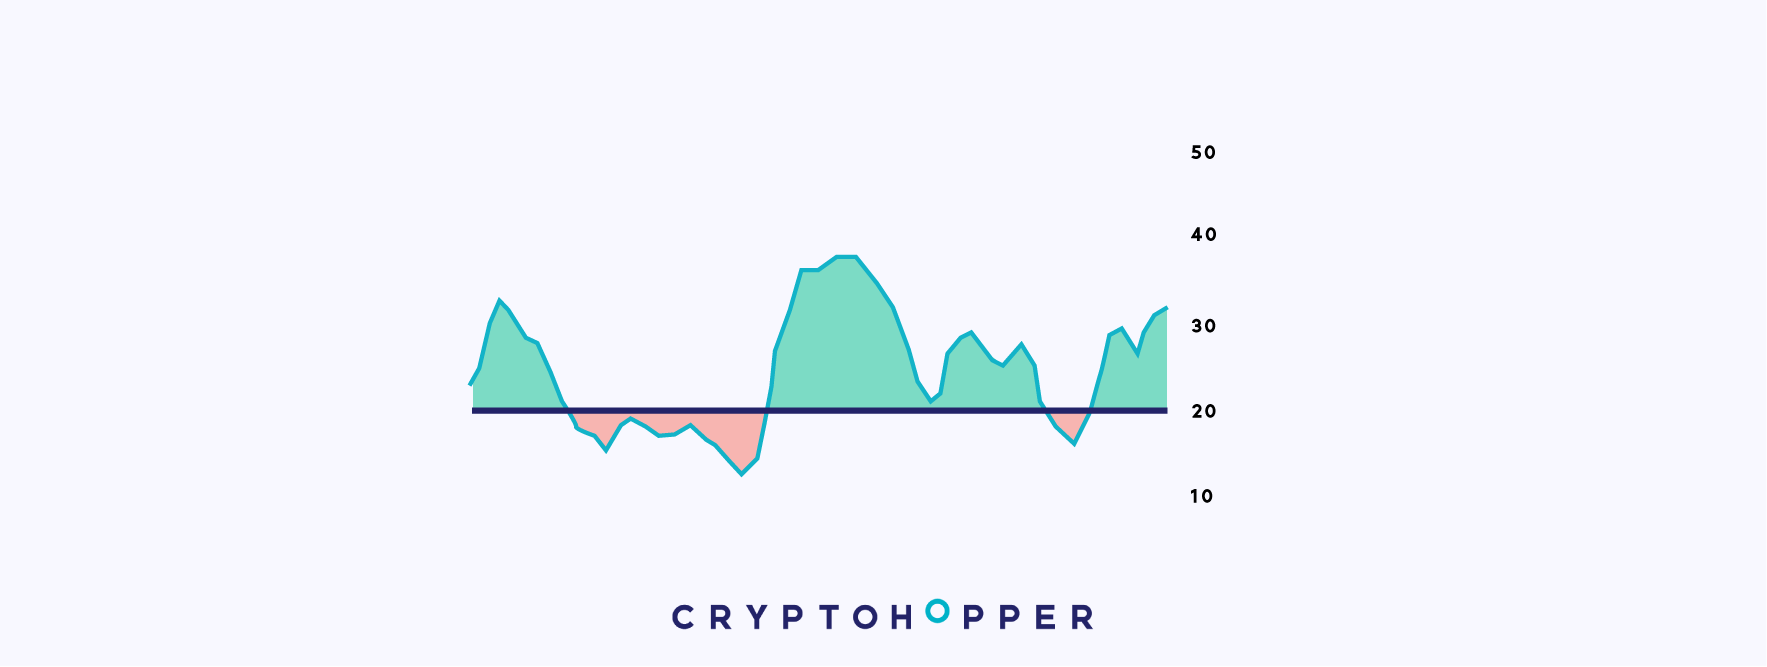
El ADX, inventado por J. Welles Wilder, mide la fuerza de una tendencia. Cuando una moneda está en rango, el ADX se mantiene por debajo de 20. Cuando emerge una tendencia direccional clara, el ADX sube. Genera señales de compra o venta cuando sube por encima de un umbral configurado — y no envía señal cuando está por debajo de él.
El ADX solo está disponible para suscriptores Hero.
Rango Verdadero Promedio (ATR)
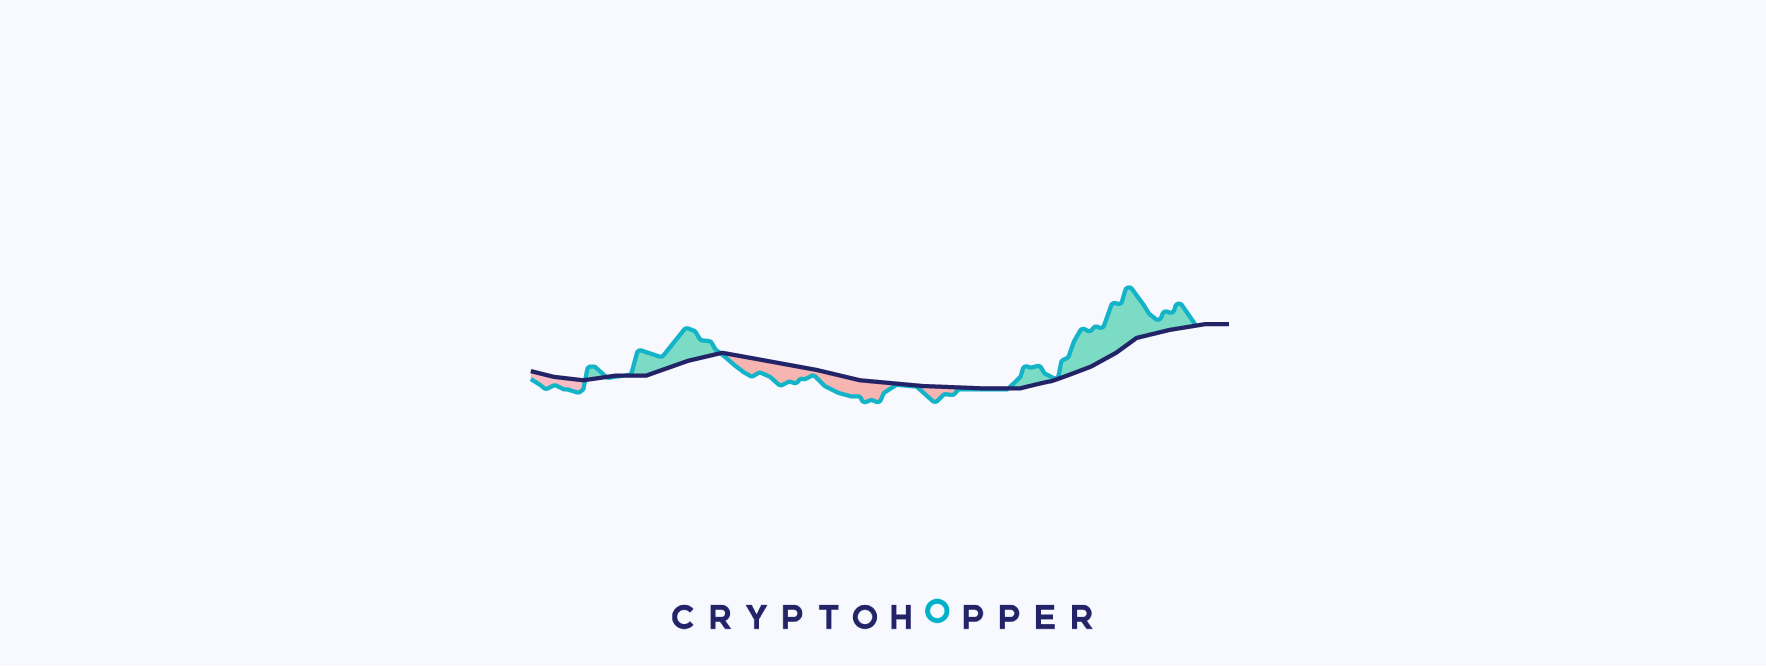
El ATR, inventado por J. Welles Wilder, es un indicador de volatilidad. A diferencia de la mayoría de los indicadores, el ATR no genera señales de compra o venta por sí solo — en su lugar actúa como un filtro de volatilidad. Cuando la línea del ATR está por encima de su media móvil, la volatilidad es alta y el ATR permite que otros indicadores generen señales. Cuando está por debajo, el mercado está en rango y las señales se filtran.
El ATR solo está disponible para suscriptores Hero.
Bandas de Bollinger (BB)
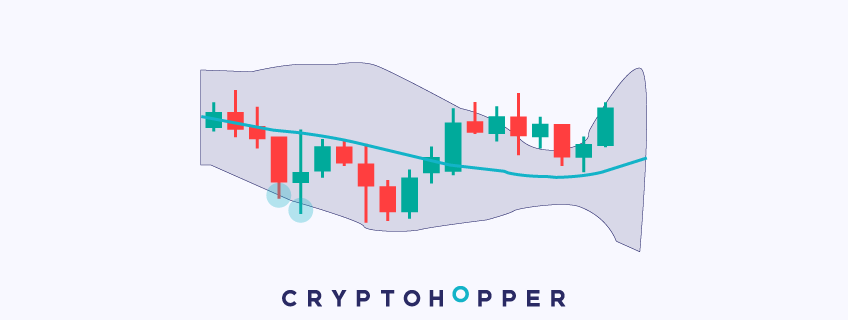
Creadas por John Bollinger, las Bandas de Bollinger miden la volatilidad a través de una banda superior e inferior alrededor de una media móvil. Las bandas se amplían durante alta volatilidad y se contraen durante baja volatilidad. La banda inferior se usa típicamente para identificar puntos de compra y la banda superior para identificar puntos de venta o corto.
Oscilador Chaikin A/D
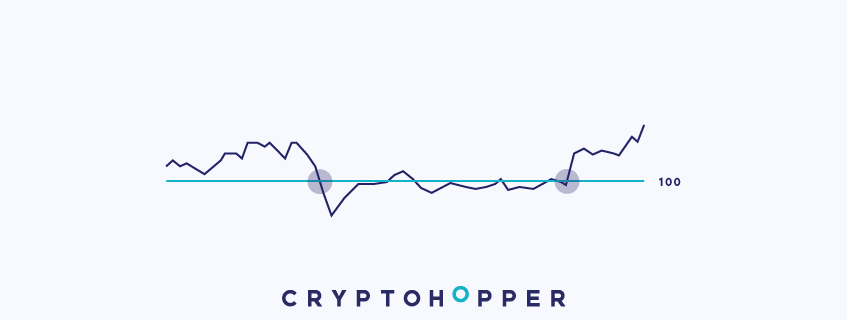
El Oscilador Chaikin A/D es un indicador de momentum que añade volumen a su análisis. Fluctúa alrededor de cero. Cuando cruza por encima de cero, se está construyendo momentum alcista y se genera una señal de compra. Cuando cruza por debajo de cero, el momentum bajista toma el control y se genera una señal de venta.
Índice de Canal de Materias Primas (CCI)
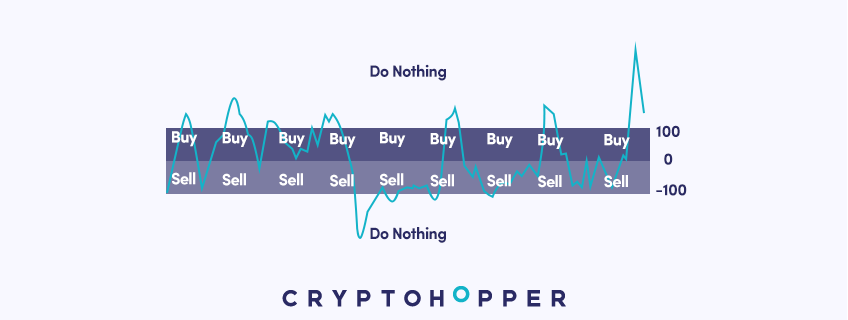
El CCI, desarrollado por Donald Lambert en 1980, fluctúa alrededor de cero. Cuando el CCI está entre 0 y -100, envía una señal de compra persistente. Cuando está entre 0 y +100, envía una señal de venta persistente. Valores por encima de +100 o por debajo de -100 resultan en señales neutrales.
Índice de Movimiento Direccional (DMI)
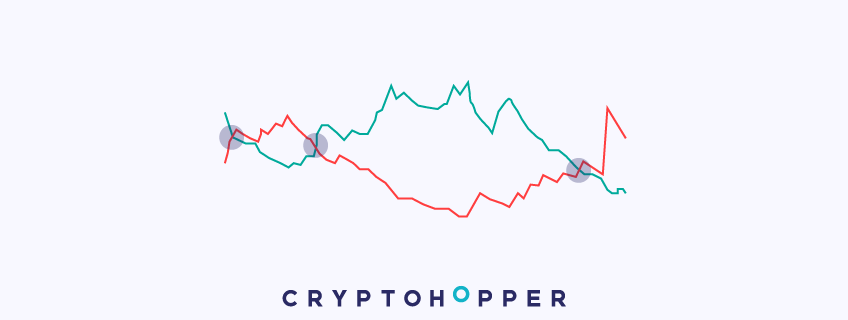
El DMI, creado por J. Welles Wilder, tiene dos líneas: movimiento direccional positivo y negativo. Se genera una señal de compra cuando la línea positiva cruza por encima de la negativa; una señal de venta cuando la positiva cruza por debajo de la negativa. Estas son señales no persistentes, enviadas solo en los cruces.
Media Móvil Exponencial Doble (DEMA)
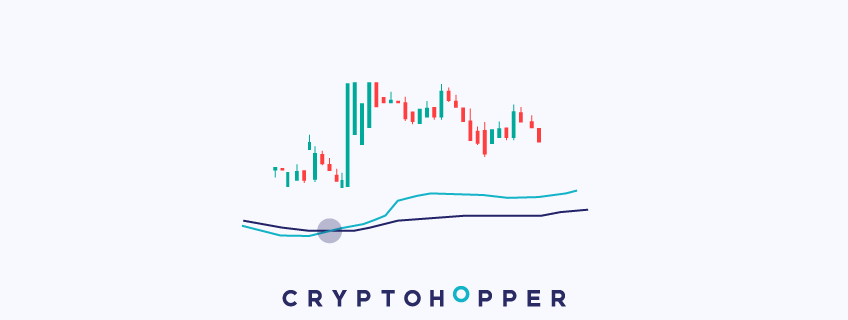
La DEMA es un indicador de tendencia rápido que reduce el retraso entre el precio y la media móvil más que una EMA estándar. Como otras medias móviles, genera señales a través de cruces entre una media móvil rápida y una lenta.
Elder Ray
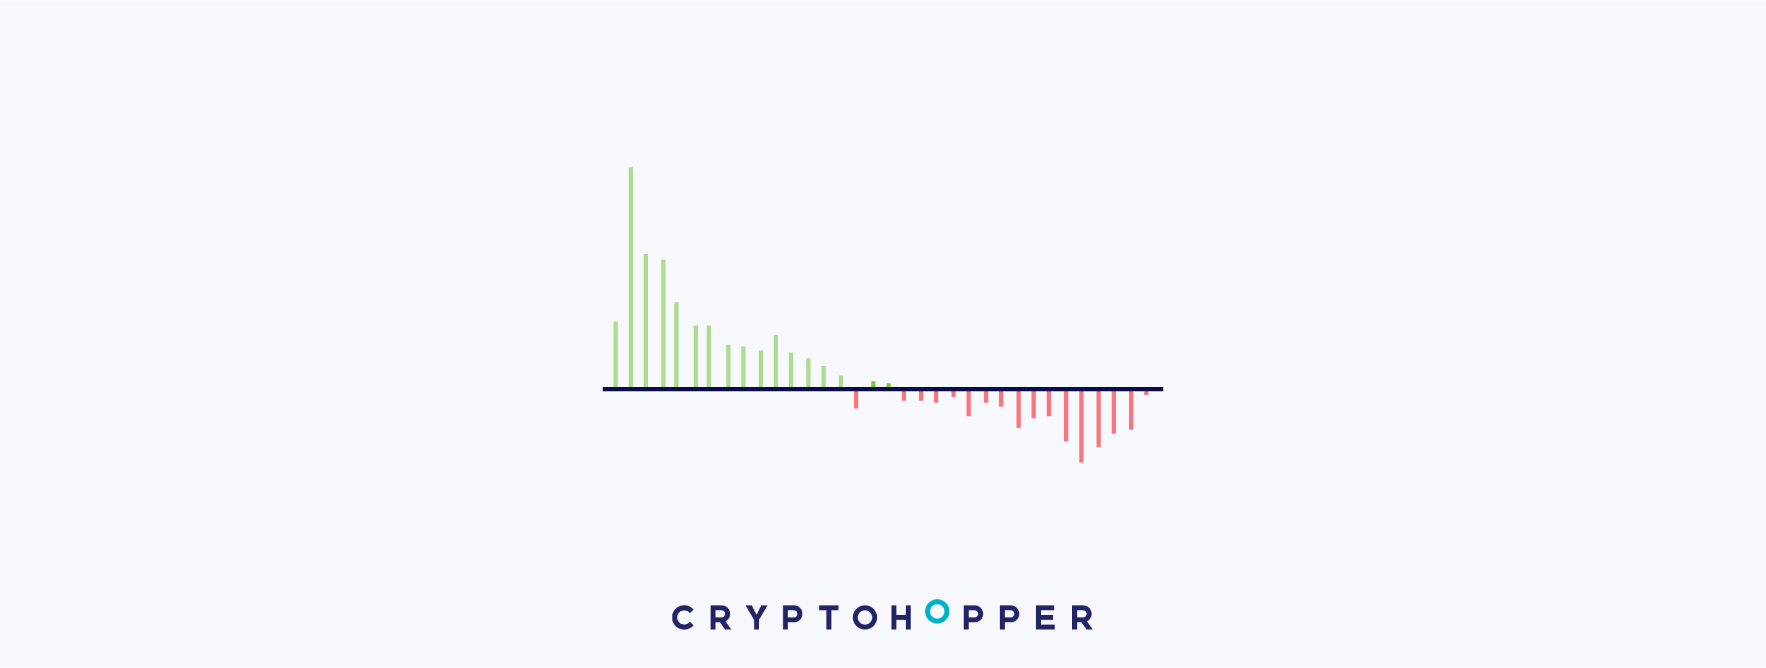
El Elder Ray combina EMAs para medir la fuerza alcista ("poder del toro") y bajista ("poder del oso"). Usa señales persistentes — señalando compra mientras el poder del toro exceda al poder del oso, y venta mientras el poder del oso exceda al poder del toro.
Elder Ray solo está disponible para suscriptores Hero.
Media Móvil Exponencial (EMA)

La EMA es un indicador de tendencia común que reacciona más rápido que la SMA al dar más peso a los precios de cierre recientes. Las señales de compra y venta se generan a través de cruces entre una EMA rápida y una lenta.
Media Móvil de Hull (HMA)
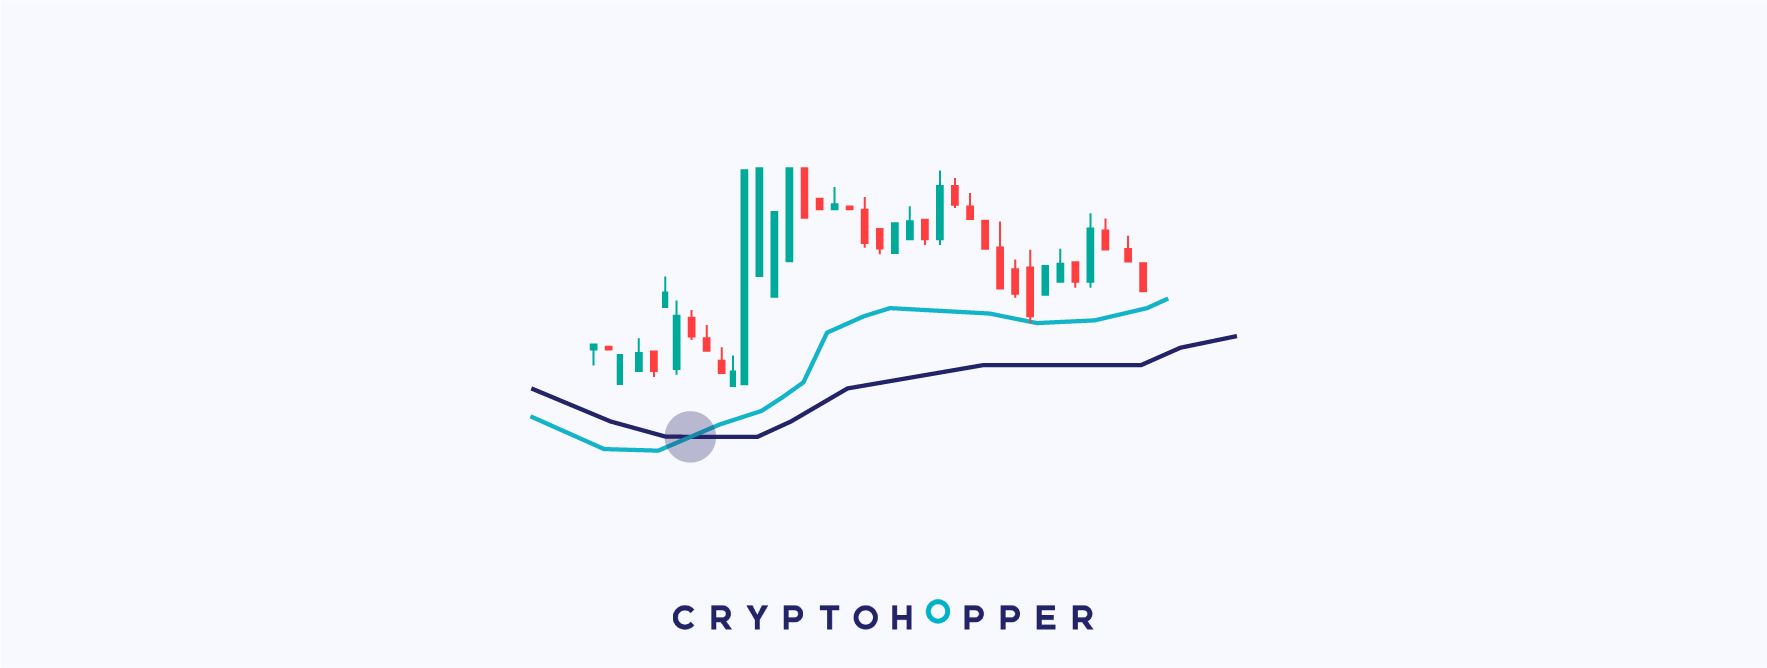
Desarrollada por Alan Hull, la HMA es uno de los indicadores de tendencia más rápidos disponibles. Reacciona muy rápidamente a los cambios de dirección del precio. Las señales de compra y venta se generan a través de cruces.
La HMA solo está disponible para suscriptores Hero.
Nube de Ichimoku
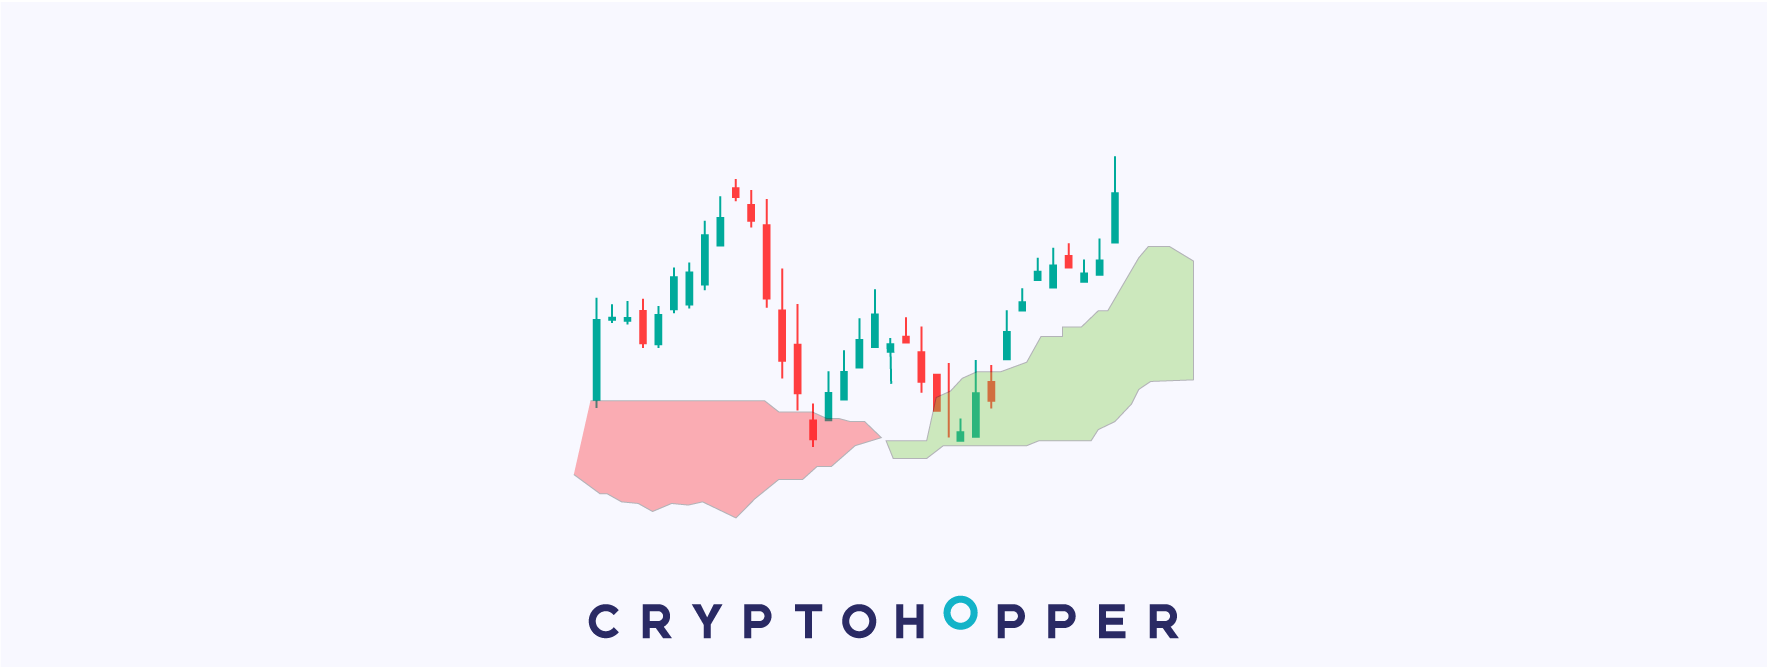
Creada por Goichi Hosada en 1969, la Nube de Ichimoku combina análisis de tendencia y momentum. Cuando el precio rompe por encima de la nube y cierra por encima de ella, se genera una señal de compra. Cuando rompe por debajo y cierra por debajo de ella, se genera una señal de venta.
La Nube de Ichimoku solo está disponible para suscriptores Hero.
Media Móvil Adaptativa de Kaufman (KAMA)
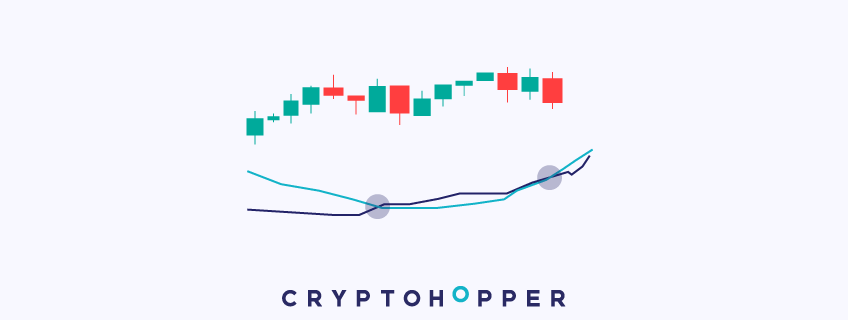
Desarrollada por Perry Kaufman, la KAMA es un indicador de tendencia que introduce un ratio de eficiencia para reducir las fluctuaciones de la media móvil durante alta volatilidad. Las señales de compra y venta se generan a través de cruces.
Media Móvil Adaptativa MESA

La MESA es un indicador de seguimiento de tendencia que se adapta a los movimientos del precio basándose en la tasa de cambio medida por el Discriminador de Transformada de Hilbert. A diferencia de otras medias móviles, MESA mantiene su señal de compra o venta hasta que ocurre el siguiente cruce — convirtiéndola en un indicador de señal persistente.
Indicador de Momentum
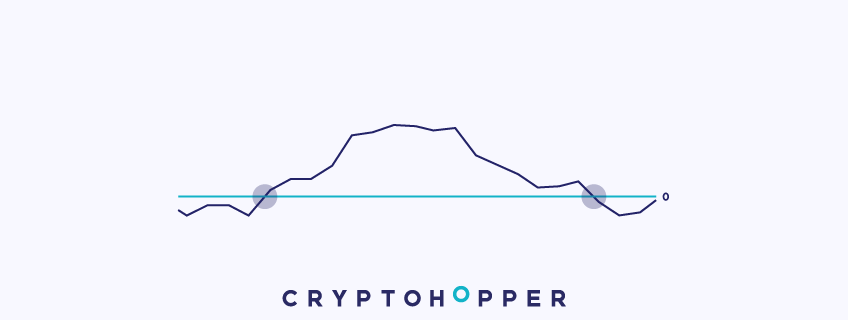
El indicador de Momentum mide el momentum comparando el precio actual con un precio de un número establecido de períodos atrás. Cuando la línea de momentum cruza de negativo a positivo, se genera una señal de compra. Cuando cruza de positivo a negativo, se genera una señal de venta.
Índice de Flujo de Dinero (MFI)
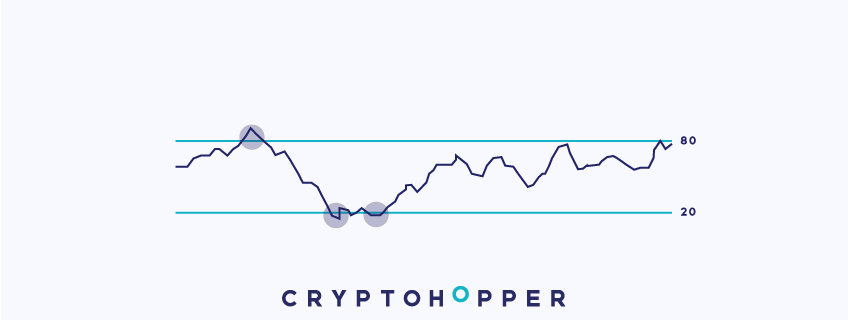
El MFI es un oscilador de momentum y volumen — a menudo llamado "el RSI que tiene en cuenta el volumen". Identifica zonas de sobrecompra y sobreventa usando tanto precio como volumen. En Cryptohopper puedes configurarlo para que señale por encima o por debajo de cualquier valor, e incluso invertir las señales para hacerlo funcionar como un indicador de seguimiento de tendencia. Seleccionar "mayor que" o "menor que" produce señales persistentes.
Convergencia/Divergencia de Medias Móviles (MACD)
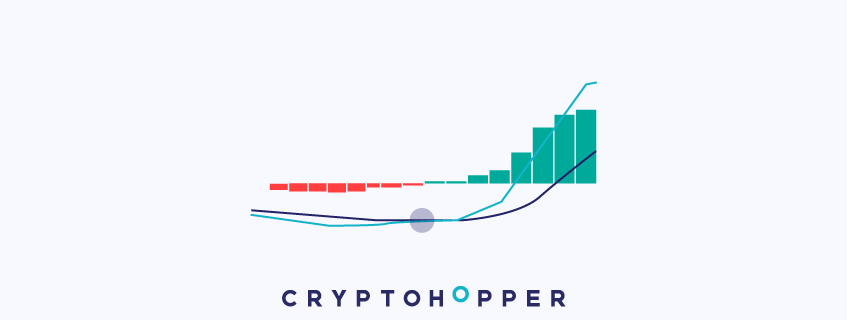
Creado por Gerald Appel, el MACD es un indicador de tendencia y momentum compuesto por dos líneas. Se genera una señal de compra cuando la línea MACD cruza por encima de la línea de señal (el histograma se vuelve verde). Se genera una señal de venta cuando cruza por debajo (el histograma se vuelve rojo). El MACD usa señales no persistentes — solo enviadas en los cruces.
Volumen en Balance (OBV)
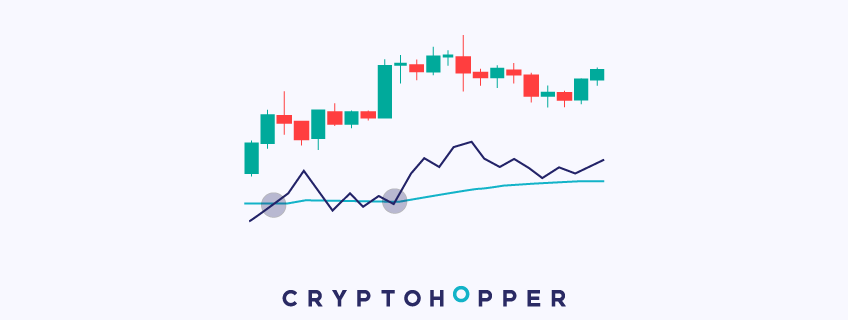
El OBV es un indicador de momentum y volumen. Se añade una media móvil a la línea OBV para generar señales — una compra cuando el OBV cruza por encima de su media móvil, una venta cuando cruza por debajo. Puedes encontrar este indicador en TradingView buscando "Cryptohopper OBV".
SAR Parabólico
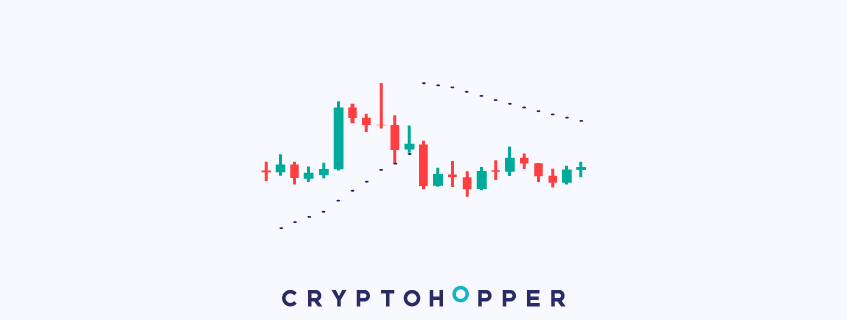
El SAR Parabólico, inventado por J. Welles Wilder, se muestra como puntos por encima o por debajo del precio. Cuando los puntos están por debajo del precio, la tendencia es alcista y se envían señales de compra. Cuando están por encima, es bajista y se envían señales de venta. Estas son señales persistentes — continúan mientras se cumplan las condiciones. Funciona bien combinado con osciladores en períodos de tiempo más pequeños.
Cambio Porcentual
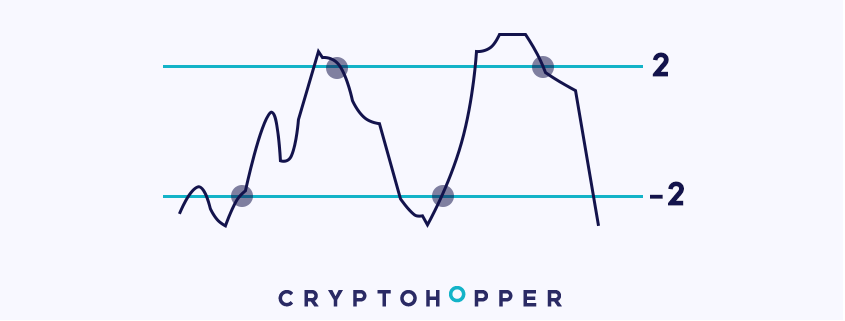
El indicador de Cambio Porcentual mide cuánto se ha movido una moneda en porcentaje durante un número específico de períodos. Por ejemplo, un gráfico de 4h con un período de 5 mira hacia atrás 20 horas. Seleccionar "mayor que" o "menor que" produce señales persistentes — el indicador sigue señalando mientras la condición sea verdadera. Ingresa valores positivos como números positivos y valores negativos como negativos (ej. 2 = 2%, -2 = -2%).
Oscilador de Precio Porcentual (PPO)
El PPO se ve y funciona casi idénticamente al MACD, pero es ligeramente más reactivo. Se genera una señal de compra cuando la media móvil rápida cruza por encima de la lenta (el histograma se vuelve verde); una señal de venta cuando cruza por debajo (el histograma se vuelve rojo). Señales no persistentes — enviadas solo en los cruces.
Tasa de Cambio (ROC)
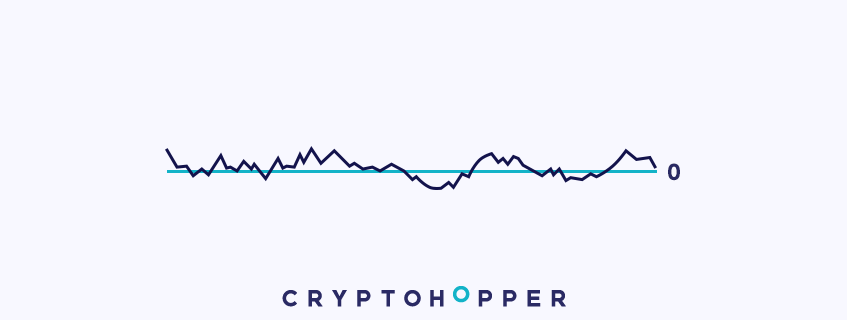
El ROC es un indicador de momentum que mide el cambio porcentual entre el precio actual y un precio pasado. Se genera una señal de compra cuando el momentum se vuelve positivo (la línea cruza por encima de 0); una señal de venta cuando el momentum se vuelve negativo (la línea cruza por debajo de 0).
Índice de Fuerza Relativa (RSI)
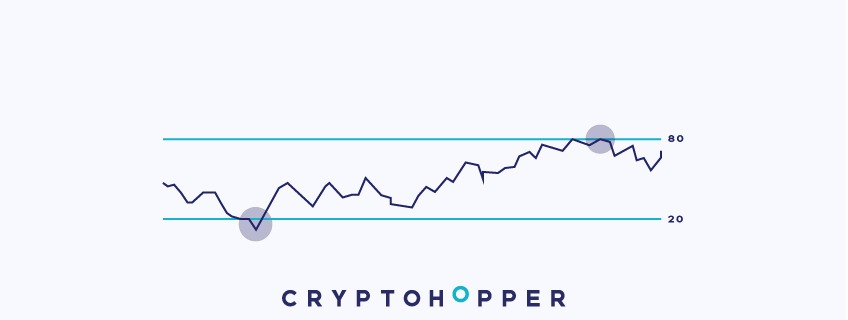
Inventado por J. Welles Wilder, el RSI es un oscilador de momentum que identifica zonas de sobrecompra y sobreventa. En Cryptohopper puedes configurarlo para que señale por encima o por debajo de cualquier valor, e incluso invertir las señales para hacerlo funcionar como un indicador de seguimiento de tendencia. Seleccionar "mayor que" o "menor que" produce señales persistentes — haciendo del RSI un gran indicador para combinar con otros.
RSI con Cruces de Región
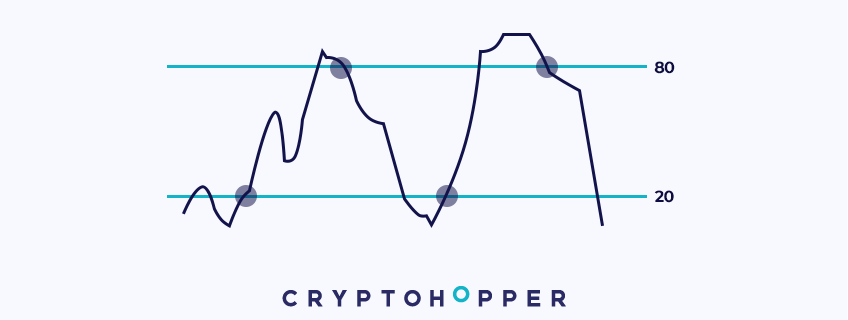
El RSI con Cruces de Región comparte los mismos valores que el RSI regular pero funciona de manera diferente. Tiene dos modos:
Señal al ENTRAR a la región (predeterminado) Envía una señal de compra cuando el RSI vuelve a cruzar por encima del umbral de sobreventa (ej. por encima de 30 después de estar por debajo). Envía una señal de venta cuando el RSI vuelve a cruzar por debajo del umbral de sobrecompra (ej. por debajo de 70 después de estar por encima).
Señal al SALIR de la región Funciona como el RSI regular — envía una señal de compra cuando el RSI cruza por debajo del umbral, y una señal de venta cuando cruza por encima.
Media Móvil Simple (SMA)
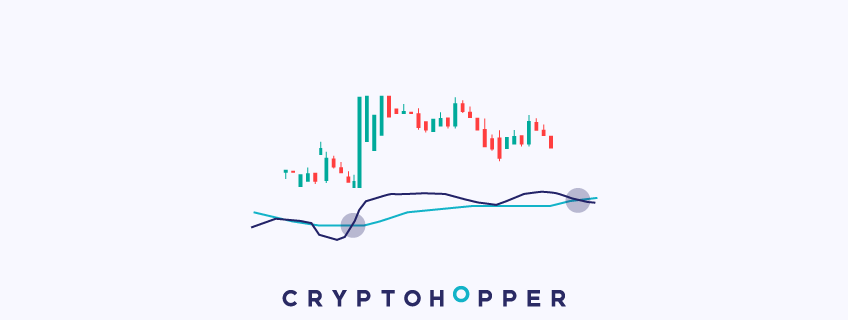
La SMA es un indicador de tendencia común que suaviza los movimientos del precio. Una SMA rápida cruzando por encima de una SMA lenta genera una señal de compra; cruzar por debajo genera una señal de venta.
Estocástico (Stoch)
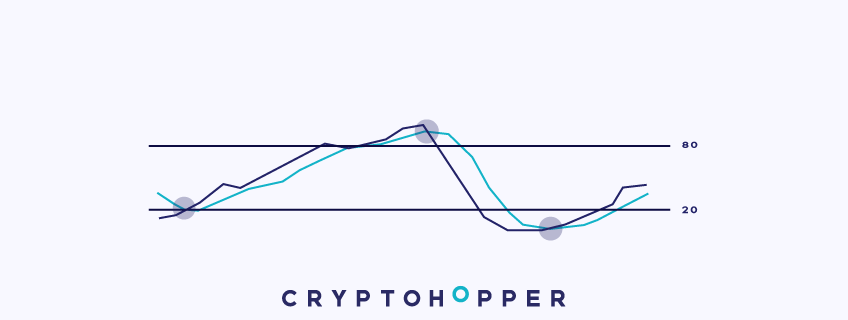
El Estocástico, desarrollado por George C. Lane, es un indicador de momentum similar al RSI pero más volátil. En Cryptohopper, las líneas %K y %D se promedian. Puedes configurarlo para que señale por encima, por debajo o igual a cualquier valor, e incluso invertir las señales. Seleccionar "mayor que" o "menor que" produce señales persistentes.
RSI Estocástico (StochRSI)
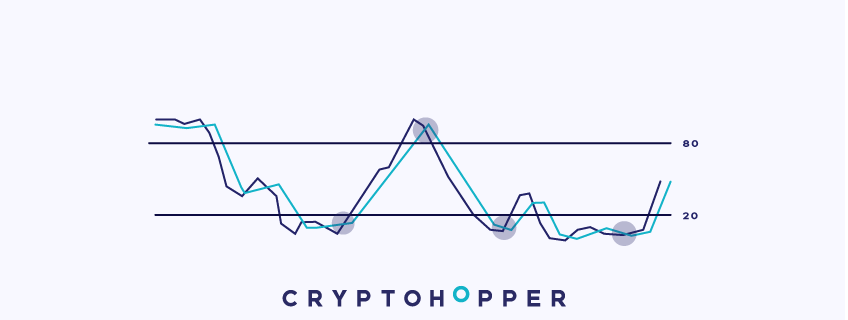
El StochRSI aplica la fórmula del Estocástico a los valores del RSI, haciéndolo más volátil que el Estocástico estándar. En Cryptohopper, las líneas %K y %D se promedian. Funciona igual que otros osciladores — puedes configurarlo para que señale por encima, por debajo o igual a cualquier valor. Seleccionar "mayor que" o "menor que" produce señales persistentes.
Estocástico con Cruces de Región
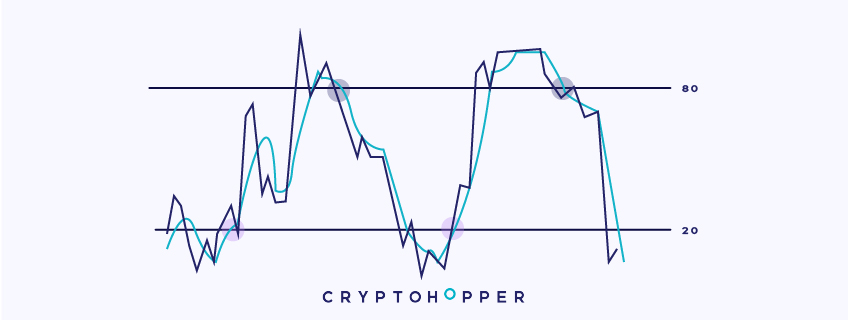
El Estocástico con Cruces de Región comparte los mismos valores que el Estocástico regular pero funciona de manera diferente. Las líneas %K y %D se promedian. Tiene dos modos:
Señal al ENTRAR a la región (predeterminado) Envía una señal de compra cuando el Estocástico vuelve a cruzar por encima del umbral de sobreventa. Envía una señal de venta cuando vuelve a cruzar por debajo del umbral de sobrecompra.
Señal al SALIR de la región Funciona como el Estocástico regular — envía una señal de compra cuando el Estocástico cruza por debajo del umbral, y una señal de venta cuando cruza por encima.
El Estocástico con Cruces de Región solo está disponible para suscriptores Hero.
StochRSI con Cruces de Región
El StochRSI con Cruces de Región comparte los mismos valores que el StochRSI regular pero funciona de manera diferente. Las líneas %K y %D se promedian. Tiene dos modos:
Señal al ENTRAR a la región (predeterminado) Envía una señal de compra cuando el StochRSI vuelve a cruzar por encima del umbral de sobreventa. Envía una señal de venta cuando vuelve a cruzar por debajo del umbral de sobrecompra.
Señal al SALIR de la región Funciona como el Estocástico regular — envía una señal de compra cuando el StochRSI cruza por debajo del umbral, y una señal de venta cuando cruza por encima.
El StochRSI con Cruces de Región solo está disponible para suscriptores Hero.
Oscilador Definitivo (UO)
Desarrollado por Larry Williams en 1976, el UO combina períodos de corto, mediano y largo plazo para medir el momentum — haciéndolo menos volátil que los osciladores de período único. En Cryptohopper puedes configurarlo para que señale por encima, por debajo o igual a cualquier valor, e invertir las señales. Seleccionar "mayor que" o "menor que" produce señales persistentes.
Media Móvil de Tilson (T3)
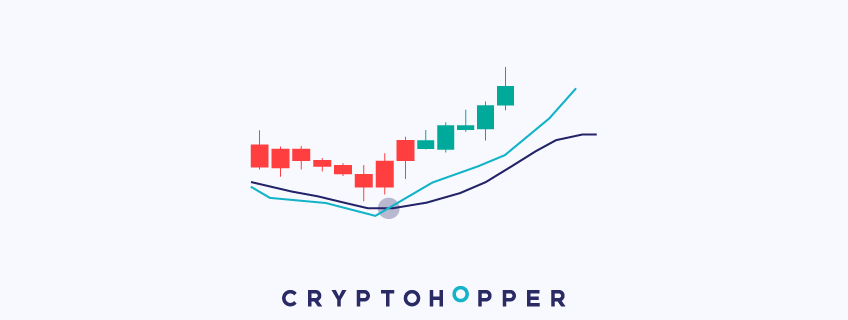
Desarrollada por Tim Tillson, la T3 es un indicador de tendencia rápido con menos retraso que la mayoría de las medias móviles. Incluye varias EMAs de otra EMA y añade un factor de volumen entre 0 y 1. Las señales de compra y venta se generan a través de cruces.
Pronóstico de Series Temporales (TSF)
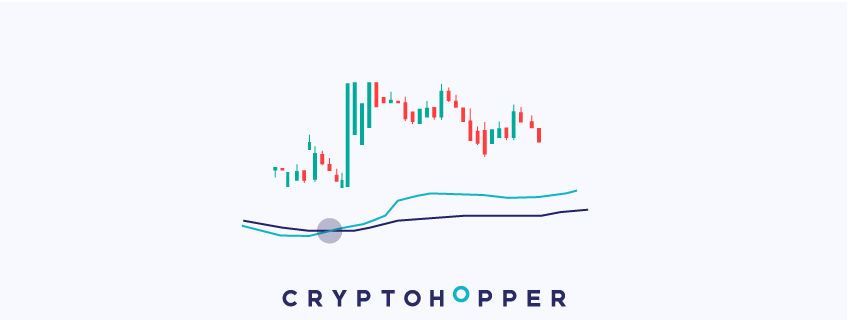
El TSF es un indicador de tendencia que usa regresión lineal para pronosticar el siguiente período de precio, reduciendo el retraso de una media móvil normal. Las señales se generan a través de cruces entre la línea TSF y una media móvil.
Media Móvil Triangular (TMA)

La TMA es un indicador de tendencia que ha sido promediado dos veces — es la SMA de una SMA. Esto crea una media móvil muy suave que filtra el ruido y señala la tendencia principal. Las señales de compra y venta se generan a través de cruces.
Media Móvil Exponencial Triple (TEMA)

Desarrollada por Patrick Mulloy, la TEMA es una de las medias móviles más rápidas disponibles. Incluye varias EMAs en su cálculo para suavizar las fluctuaciones mientras minimiza el retraso. Las señales de compra y venta se generan a través de cruces entre una media móvil rápida y una lenta.
Media Móvil Ponderada (WMA)

La WMA es un indicador de tendencia rápido que asigna mayor peso a los períodos más recientes. Es más rápida que la SMA y la EMA pero más lenta que la DEMA. Las señales de compra y venta se generan a través de cruces entre una media móvil rápida y una lenta.
Porcentaje R de Williams (%R)
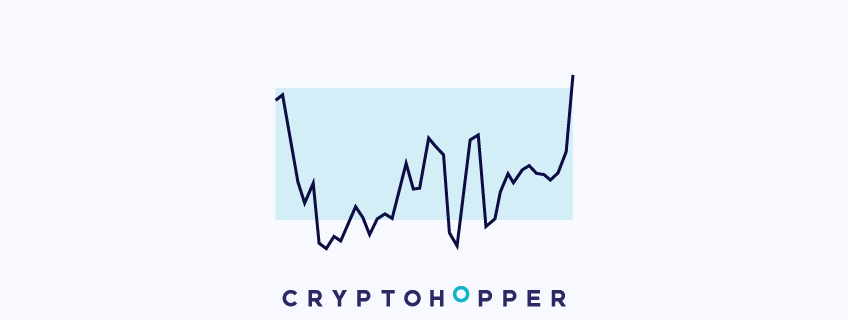
Desarrollado por Larry Williams, el Williams %R es un indicador de momentum que oscila entre -100 y 0. La zona de sobrecompra está entre -20 y 0; la zona de sobreventa entre -100 y -80. En Cryptohopper puedes configurarlo para que señale por encima, por debajo o igual a cualquier valor, e incluso invertir las señales. Seleccionar "mayor que" o "menor que" produce señales persistentes — haciendo de este un gran indicador para combinar con otros.