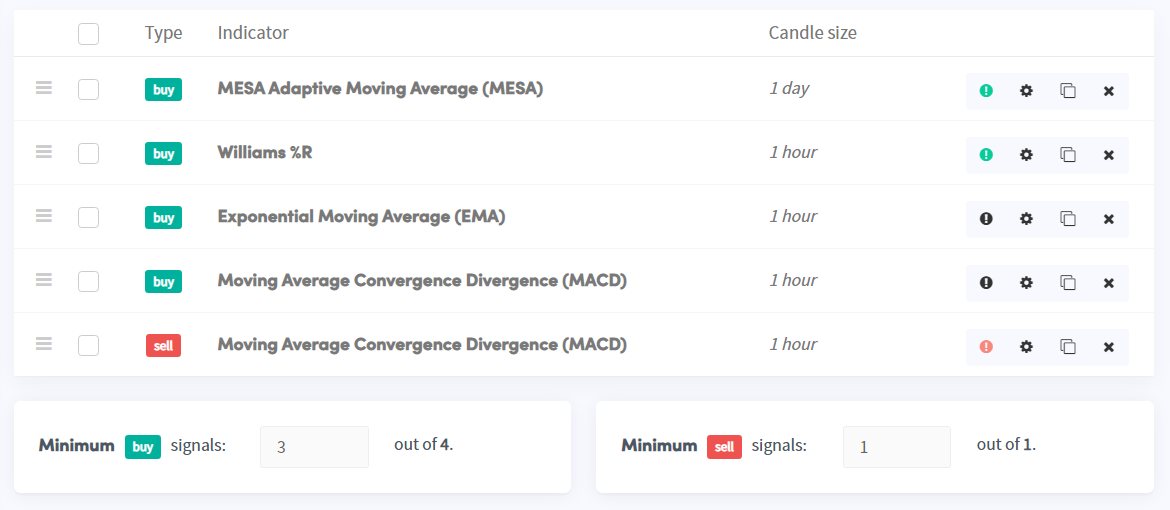
An example of a Strategy built with the Strategy Builder
This article shows an example of a Strategy created with the Strategy Builder.
This is an example only. Always do your own research before building and deploying a strategy.
Example Strategy
In this example, we build a strategy using three indicators: MESA to identify the broader trend, William's %R to find buy points, and EMA to confirm the trend direction. A MACD sell indicator is then added to close positions.
Step 1 — MESA (daily chart, buy signal)
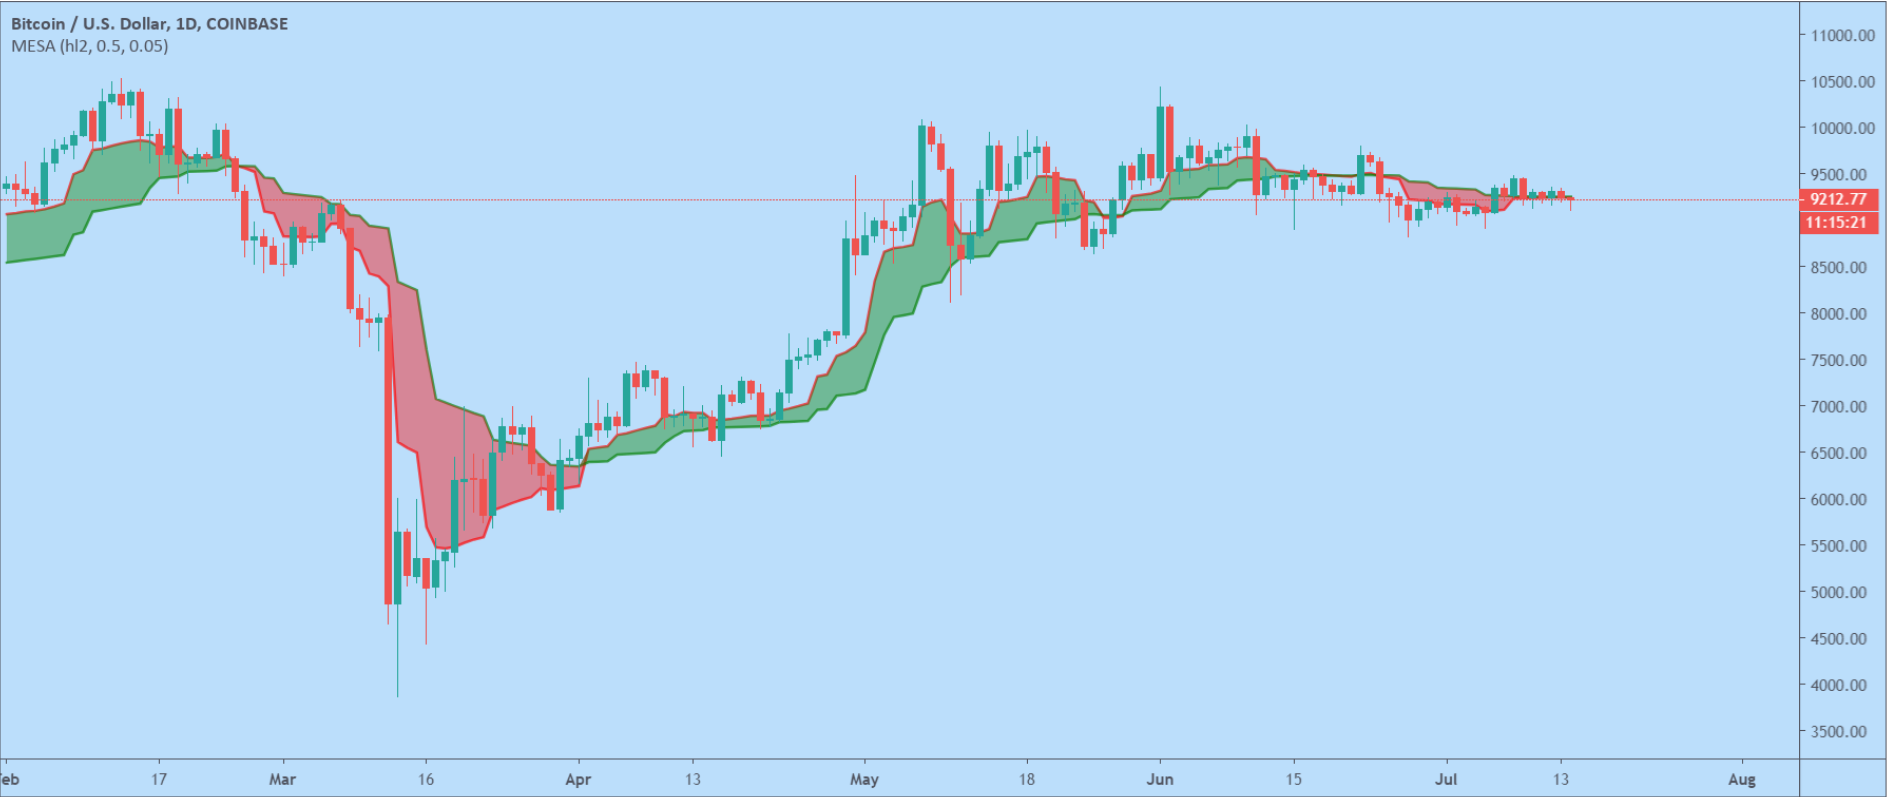
We use the MESA on the daily chart to identify a bullish market. The MESA indicates a bullish market as long as the cloud is green.
Settings used in this example:
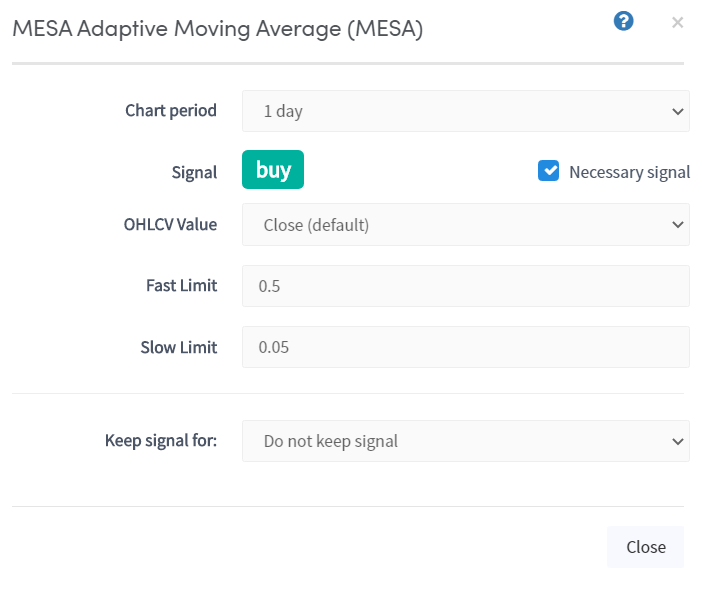
Chart period: 1 day Signal: Buy OHLCV value: Close (default) Fast limit: 0.5 (default) Slow limit: 0.05 (default) Keep signal for: Not necessary for this indicator Necessary signal: Yes — the MESA must always be bullish to enter a trade
Step 2 — William's %R (1-hour chart, buy signal)
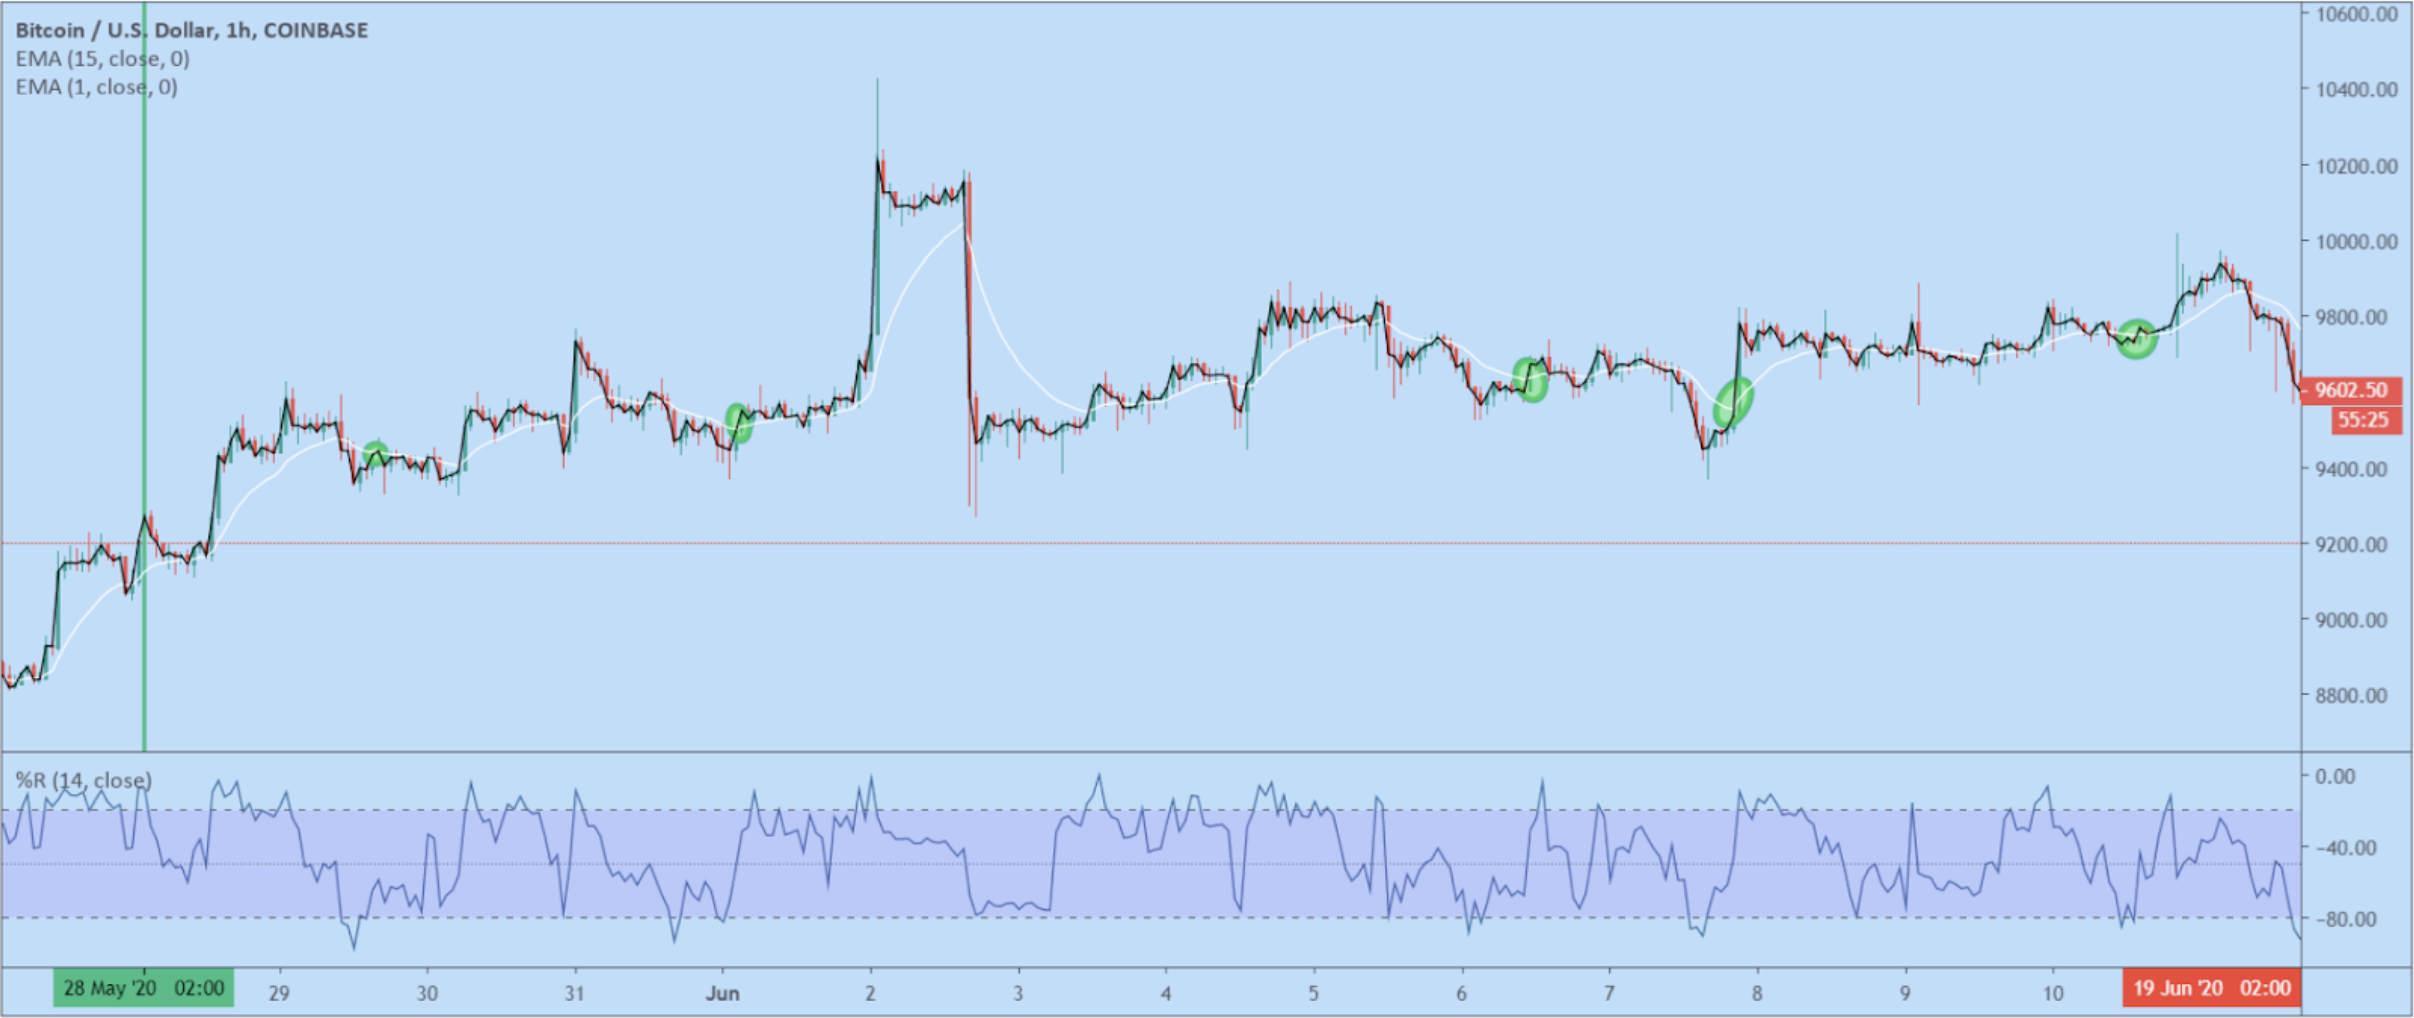
William's %R identifies a bottom each time the line falls below -80. It can find great buy points in a bullish market, but has a drawback: in a crashing market it signals buys continuously. We combine it with the MESA and EMA to filter out bad signals.
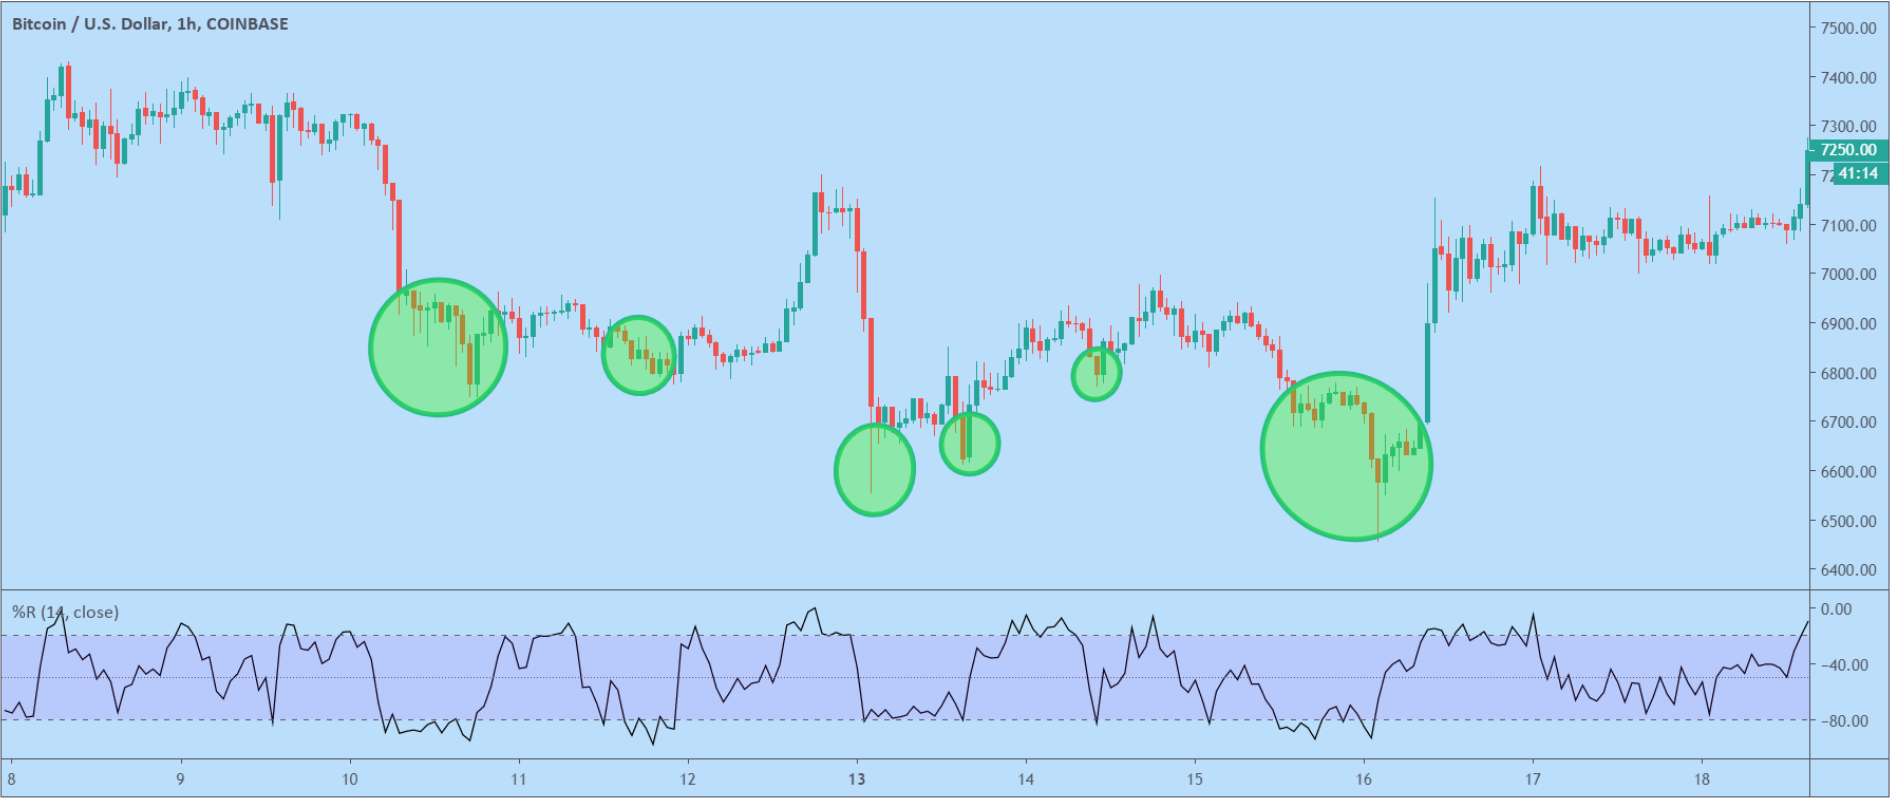
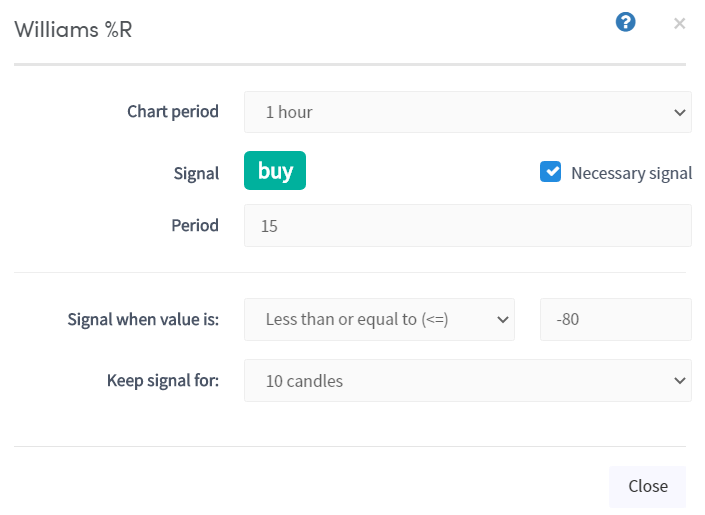
We set William's %R to keep its signal for 10 candles. It's rare for William's %R to be oversold at the same time as the EMA crossover signals bullish — so keeping the signal for 10 candles allows the indicators to align.
Step 3 — EMA crossover (buy signal)
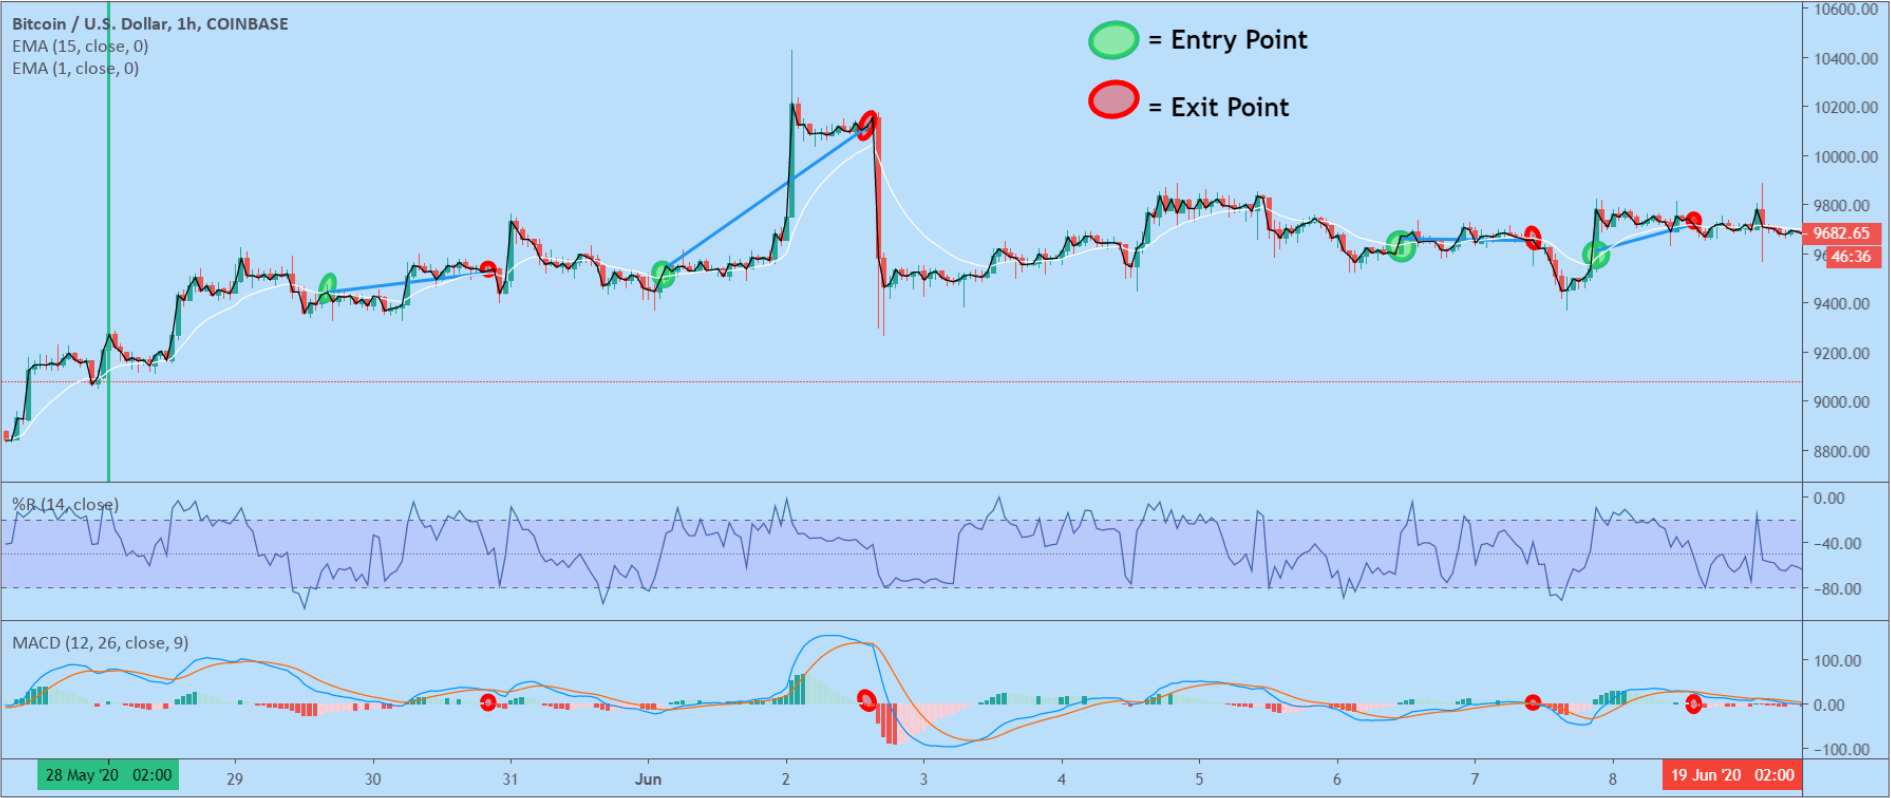
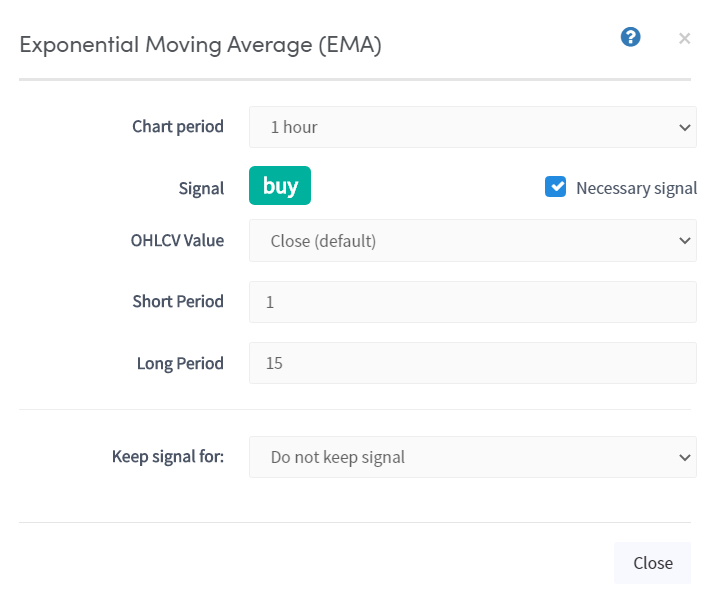
A crossover of the 1 and 15 EMA confirms when the trend turns bullish again. A buy signal is generated each time the fast EMA crosses above the slow EMA.
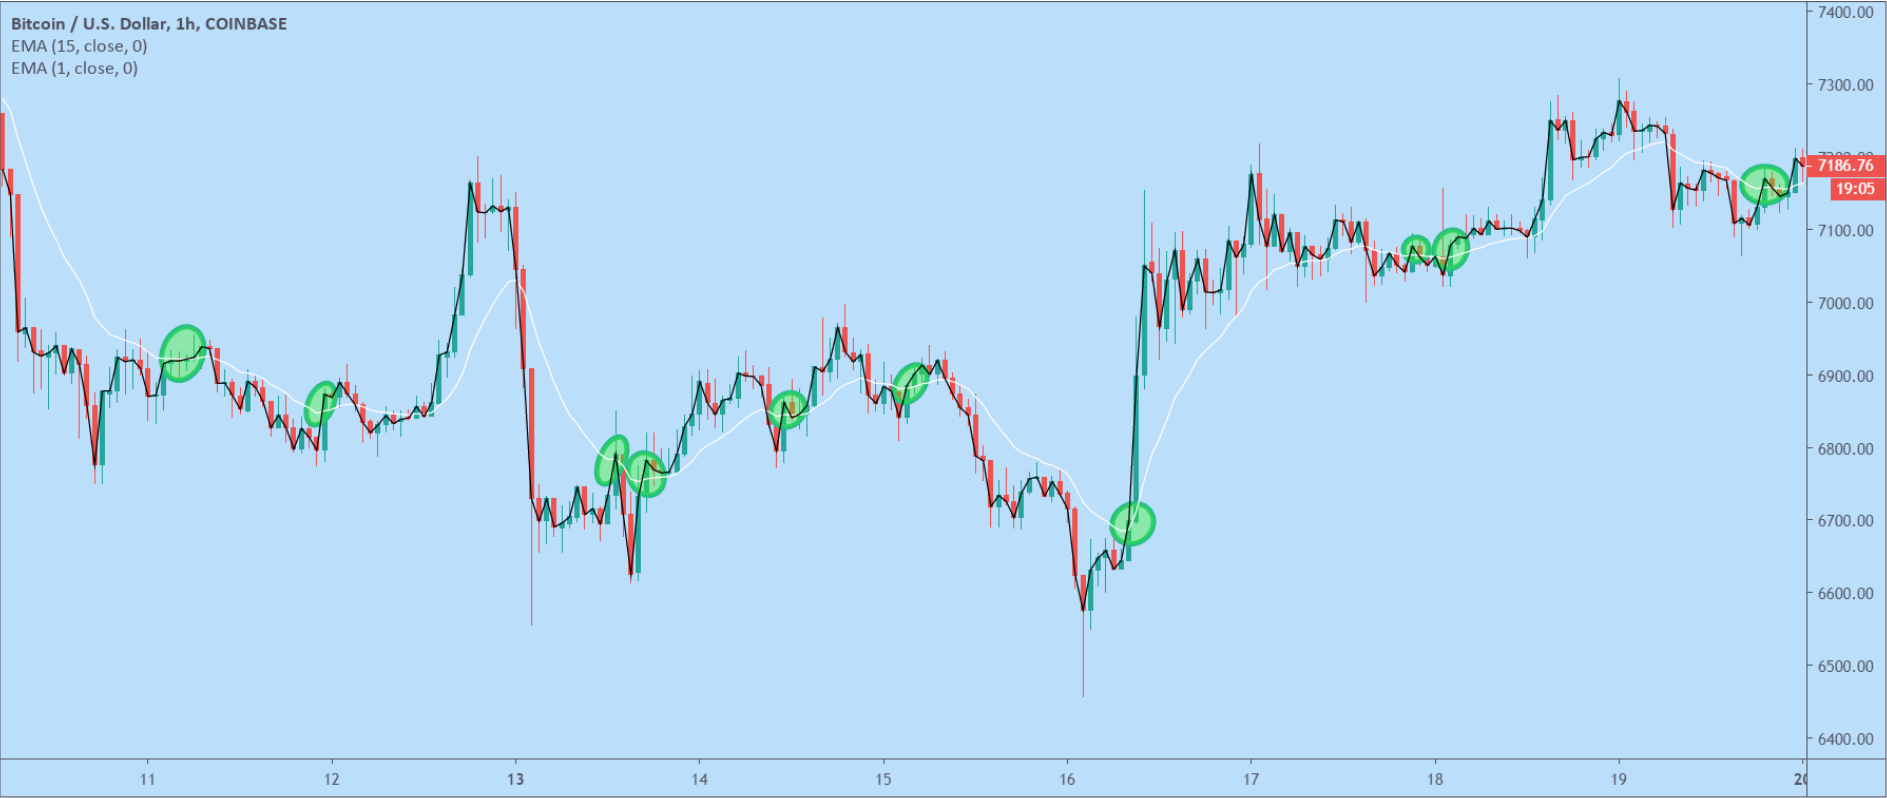
Step 4 — Minimum buy signals
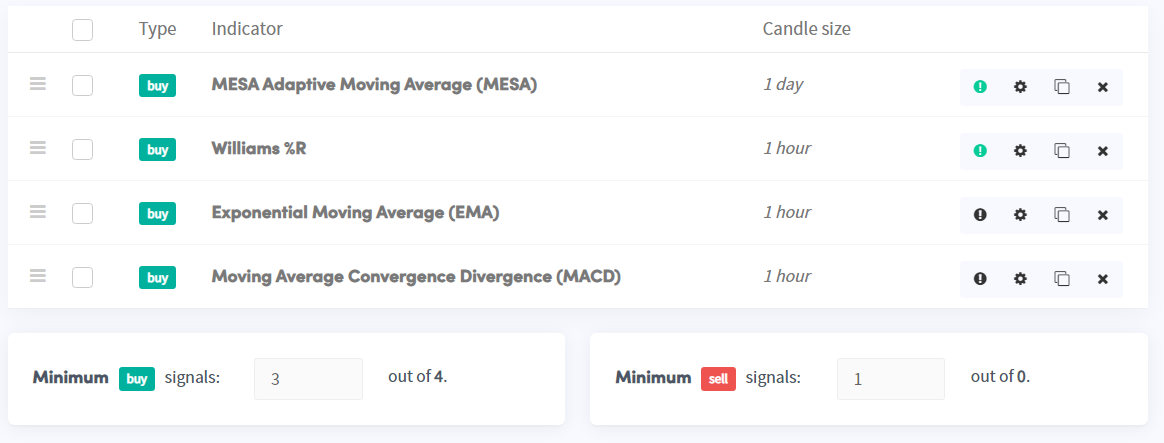
We set the minimum buy signals to 3 out of 3 — meaning all three indicators must signal a buy simultaneously before the bot opens a position.

This setting is flexible. For example, if you add a MACD as a substitute for the EMA, you could set the minimum to 3 out of 4. The MESA and William's %R remain necessary, while either the EMA or MACD can satisfy the third requirement.
Step 5 — MACD sell indicator (1-hour chart)
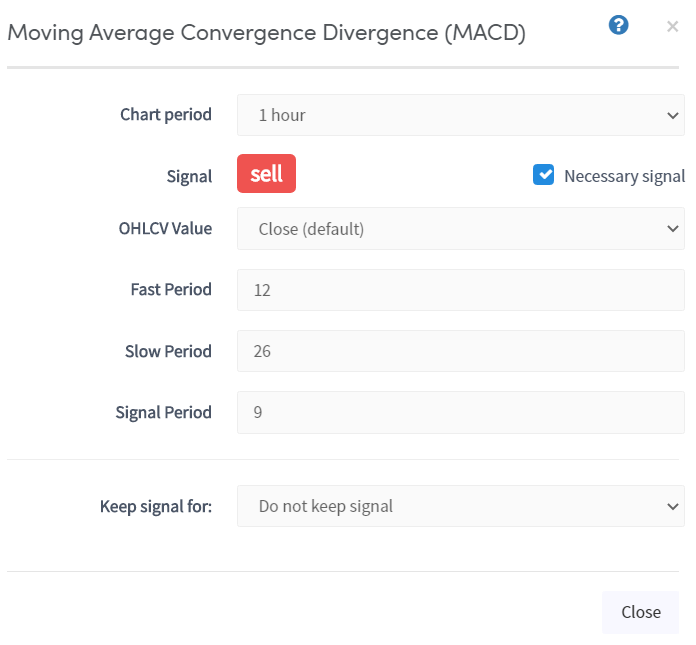
To close positions, we add a MACD sell indicator on the hourly chart. To configure an indicator as a sell signal, click the green "buy" button in the indicator menu to toggle it to "sell".
Final strategy