Technical indicators
This article shows all Technical Indicators available on Cryptohopper. These indicators can be divided into four different types. Read more about the different types here.
Absolute Price Oscillator (APO)
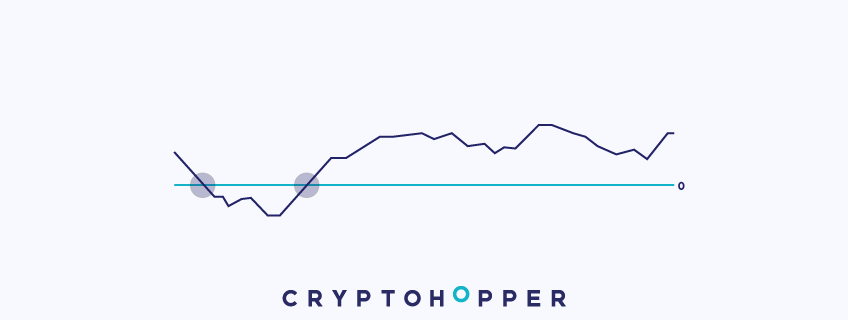
The APO is essentially a moving average crossover strategy displayed as a line oscillating around zero. When the shorter moving average crosses above the longer one, the line crosses above 0 and generates a buy signal. When the shorter crosses below the longer, the line drops below 0 and generates a sell signal. On Cryptohopper you can combine different types of moving averages — for example, a Simple Moving Average with an Exponential Moving Average.
Aroon
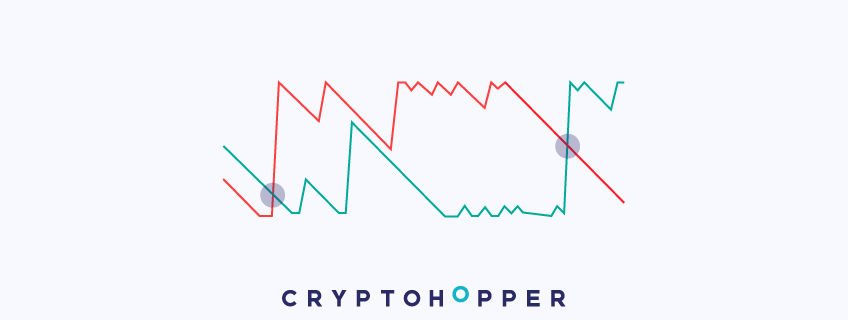
Aroon is a momentum oscillator also used to spot trends. It has two lines — Aroon Up and Aroon Down — fluctuating between 0 and 100. Aroon Up measures the frequency of new highs; Aroon Down measures new lows. A buy signal is generated when Aroon Up crosses above Aroon Down; a sell signal when Aroon Down crosses above Aroon Up.
Aroon Oscillator
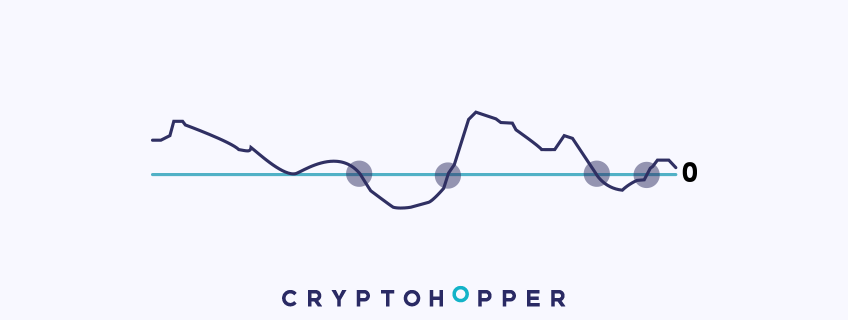
The Aroon Oscillator calculates the difference between Aroon Up and Aroon Down, plotted on a scale from -100 to +100. It works identically to the regular Aroon and provides the same buy/sell signals — the only difference is visual.
Average Directional Movement (ADX)
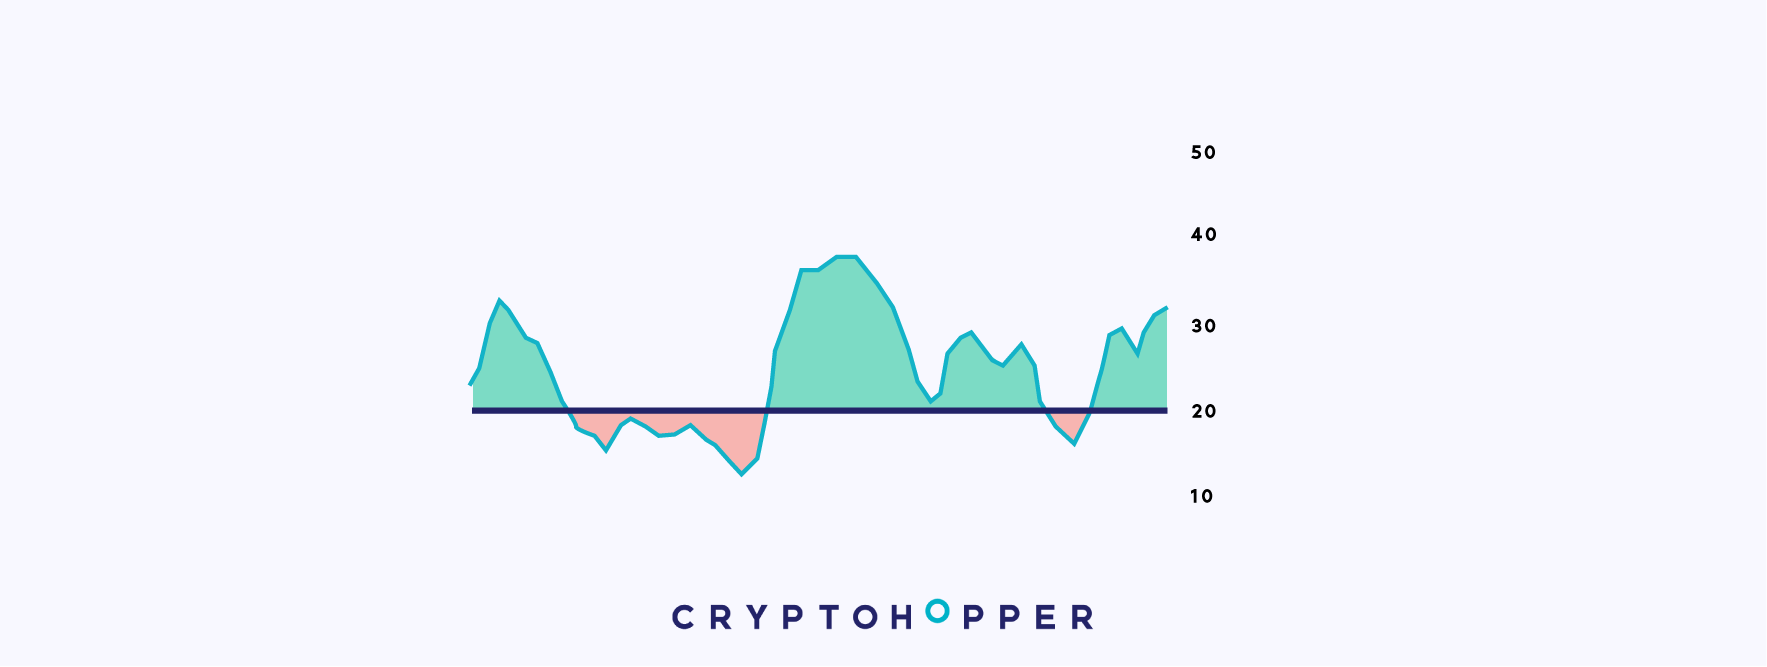
The ADX, invented by J. Welles Wilder, measures the strength of a trend. When a coin is ranging, ADX stays below 20. When a clear directional trend emerges, ADX rises. It generates buy or sell signals when it rises above a configured threshold — and sends no signal when below it.
ADX is only available to Hero subscribers.
Average True Range (ATR)
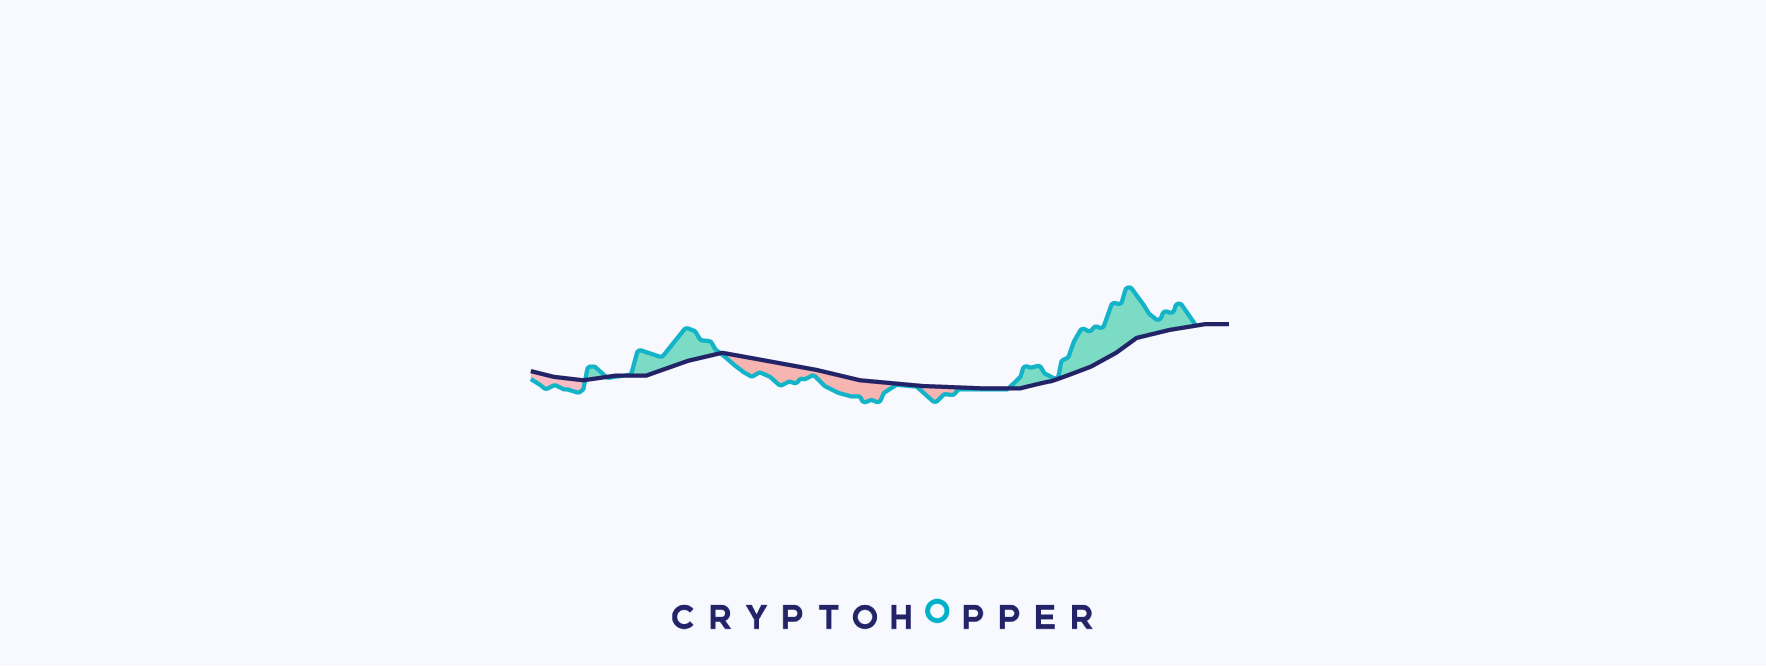
The ATR, invented by J. Welles Wilder, is a volatility indicator. Unlike most indicators, the ATR does not generate buy or sell signals on its own — instead it acts as a volatility filter. When the ATR line is above its moving average, volatility is high and the ATR allows other indicators to generate signals. When below, the market is ranging and signals are filtered out.
ATR is only available to Hero subscribers.
Bollinger Bands (BB)
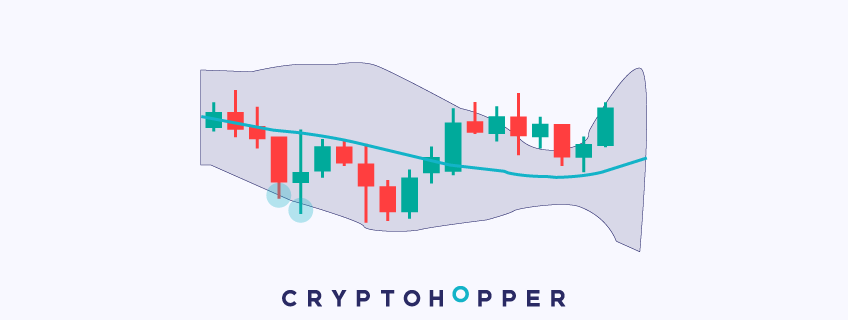
Created by John Bollinger, Bollinger Bands measure volatility through an upper and lower band around a moving average. The bands widen during high volatility and shrink during low volatility. The lower band is typically used to identify buy points and the upper band to identify sell or short points.
Chaikin A/D Oscillator
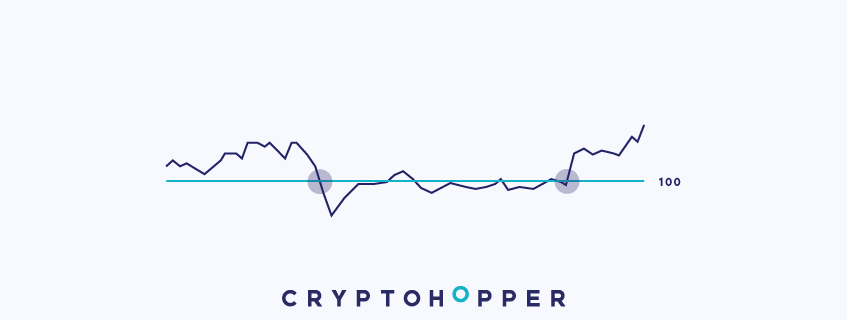
The Chaikin A/D Oscillator is a momentum indicator that adds volume to its analysis. It fluctuates around zero. When it crosses above zero, bullish momentum is building and a buy signal is generated. When it crosses below zero, bearish momentum takes over and a sell signal is generated.
Commodity Channel Index (CCI)
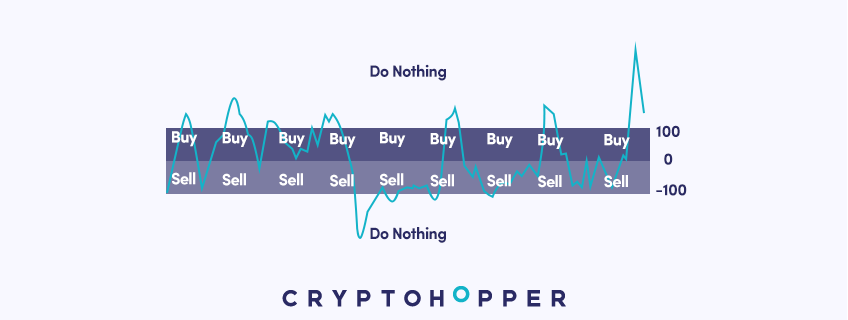
The CCI, developed by Donald Lambert in 1980, fluctuates around zero. When the CCI is between 0 and -100, it sends a sticking buy signal. When between 0 and +100, it sends a sticking sell signal. Values above +100 or below -100 result in neutral signals.
Directional Movement Index (DMI)
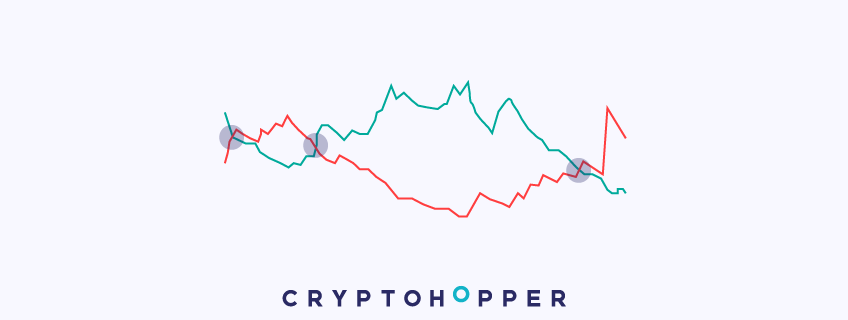
The DMI, created by J. Welles Wilder, has two lines: positive and negative directional movement. A buy signal is generated when the positive line crosses above the negative; a sell signal when the positive crosses below the negative. These are non-sticking signals, sent only at crossovers.
Double Exponential Moving Average (DEMA)

The DEMA is a fast trend indicator that reduces the lag between price and moving average more than a standard EMA. Like other moving averages, it generates signals through crossovers between a fast and slow moving average.
Elder Ray
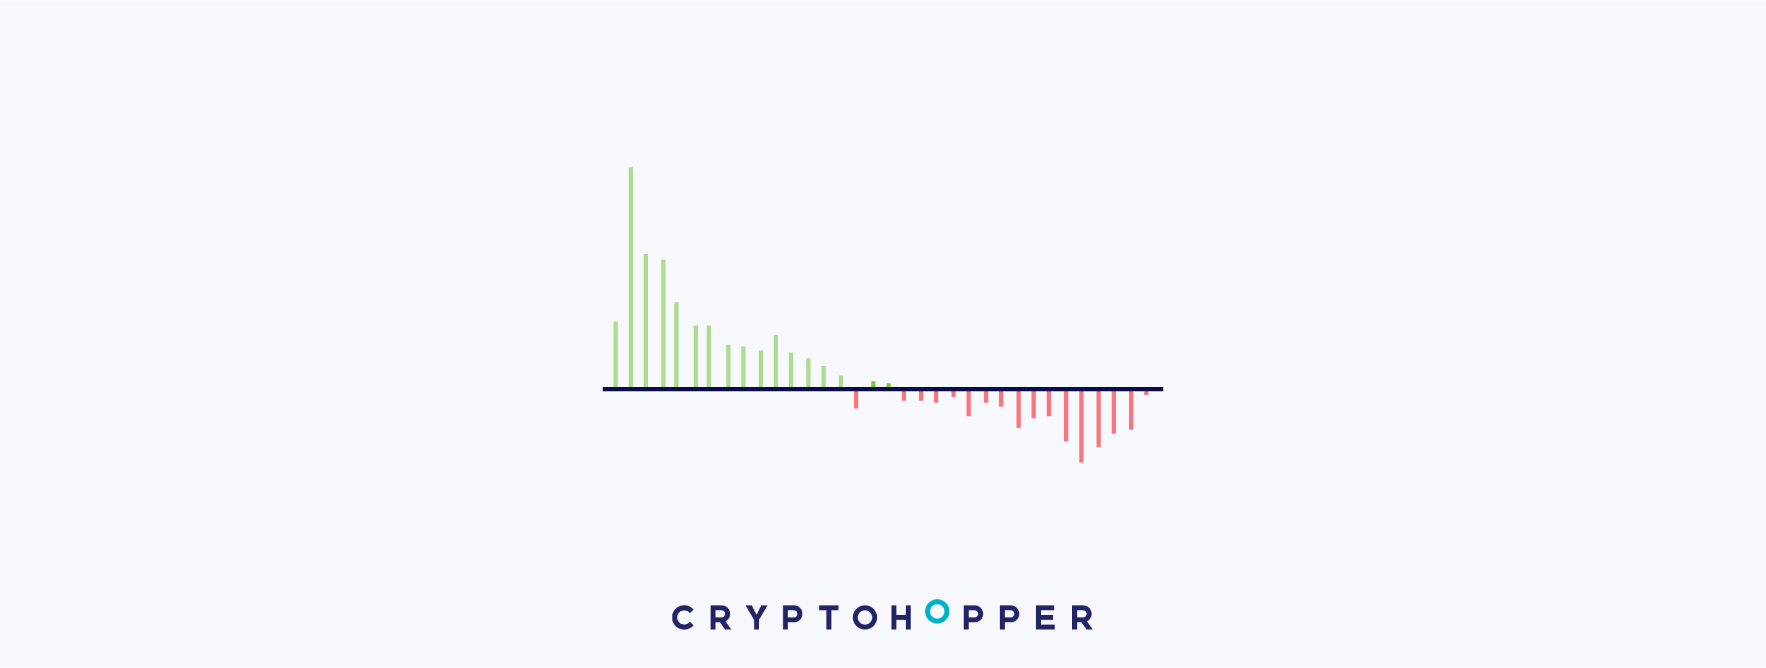
The Elder Ray combines EMAs to measure bullish ("bull power") and bearish ("bear power") strength. It uses sticking signals — signaling a buy for as long as bull power exceeds bear power, and a sell for as long as bear power exceeds bull power.
Elder Ray is only available to Hero subscribers.
Exponential Moving Average (EMA)

The EMA is a common trend indicator that reacts faster than the SMA by giving more weight to recent closing prices. Buy and sell signals are generated through crossovers between a fast and slow EMA.
Hull Moving Average (HMA)
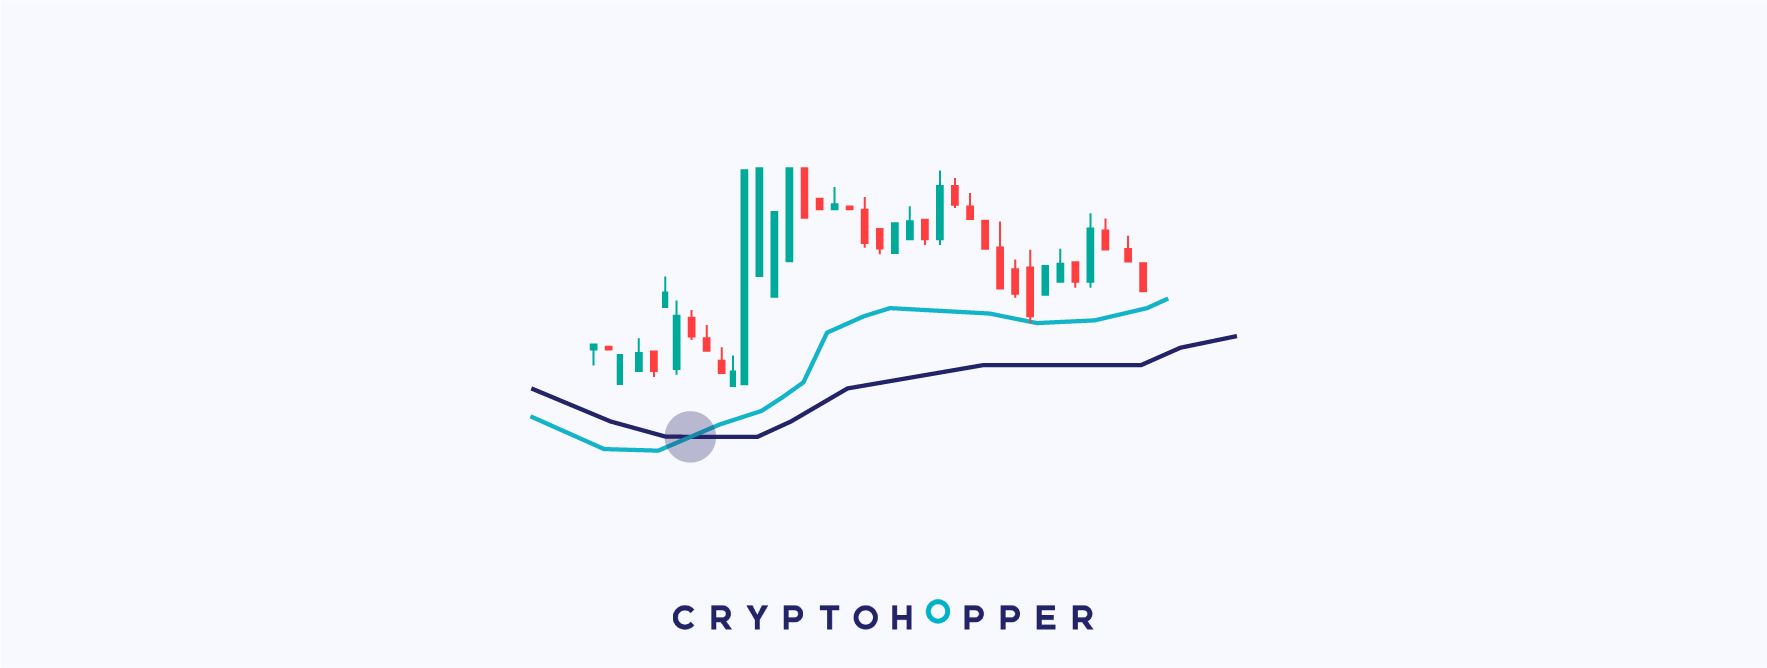
Developed by Alan Hull, the HMA is one of the fastest trend indicators available. It reacts very quickly to price direction changes. Buy and sell signals are generated through crossovers.
HMA is only available to Hero subscribers.
Ichimoku Cloud

Created by Goichi Hosada in 1969, the Ichimoku Cloud combines trend and momentum analysis. When the price breaks above the cloud and closes above it, a buy signal is generated. When it breaks below and closes below it, a sell signal is generated.
Ichimoku Cloud is only available to Hero subscribers.
Kaufman's Adaptive Moving Average (KAMA)

Developed by Perry Kaufman, the KAMA is a trend indicator that introduces an efficiency ratio to reduce moving average fluctuations during high volatility. Buy and sell signals are generated through crossovers.
MESA Adaptive Moving Average

The MESA is a trend-following indicator that adapts to price movements based on the rate of change measured by the Hilbert Transform Discriminator. Unlike other moving averages, MESA holds its buy or sell signal until the next crossover occurs — making it a sticking signal indicator.
Momentum Indicator
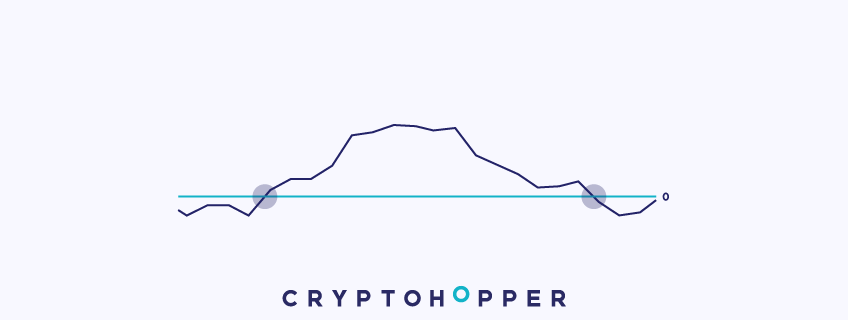
The Momentum indicator measures momentum by comparing the current price to a price a set number of periods ago. When the momentum line crosses from negative to positive, a buy signal is generated. When it crosses from positive to negative, a sell signal is generated.
Money Flow Index (MFI)
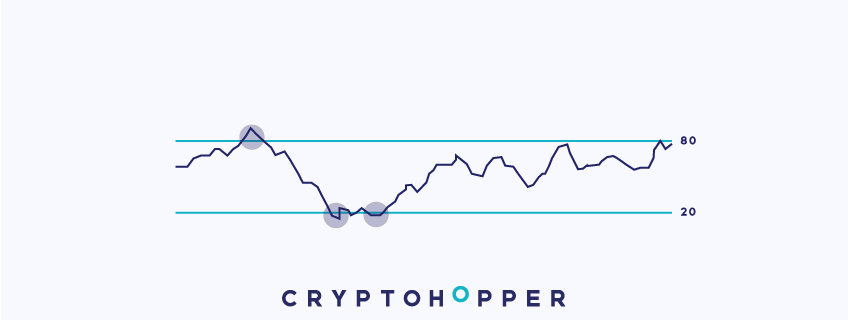
The MFI is a momentum and volume oscillator — often called "the RSI that accounts for volume." It identifies overbought and oversold zones using both price and volume. On Cryptohopper you can set it to signal above or below any value, and even inverse the signals to make it work as a trend-following indicator. Selecting "greater than" or "less than" produces sticking signals.
Moving Average Convergence Divergence (MACD)

Created by Gerald Appel, the MACD is a trend and momentum indicator comprised of two lines. A buy signal is generated when the MACD line crosses above the signal line (histogram turns green). A sell signal is generated when it crosses below (histogram turns red). MACD uses non-sticking signals — only sent at crossovers.
On Balance Volume (OBV)
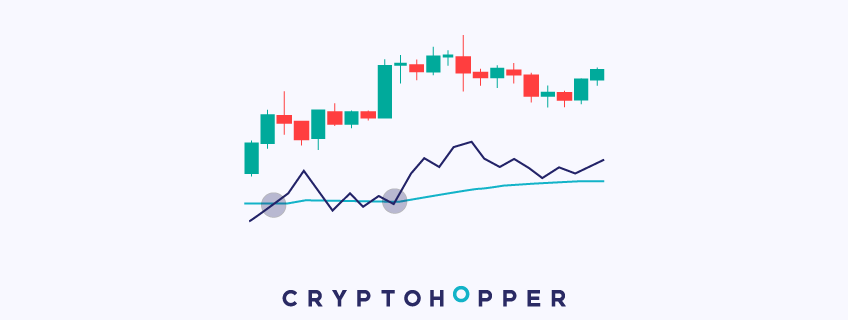
The OBV is a momentum and volume indicator. A moving average is added to the OBV line to generate signals — a buy when OBV crosses above its moving average, a sell when it crosses below. You can find this indicator on TradingView by searching "Cryptohopper OBV".
Parabolic SAR
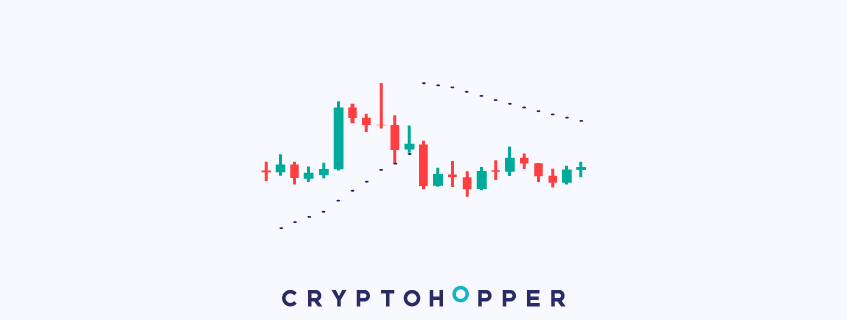
The Parabolic SAR, invented by J. Welles Wilder, is displayed as dots above or below the price. When dots are below the price, the trend is bullish and buy signals are sent. When above, it's bearish and sell signals are sent. These are sticking signals — they continue as long as conditions are met. Works well combined with oscillators on smaller timeframes.
Percent Change
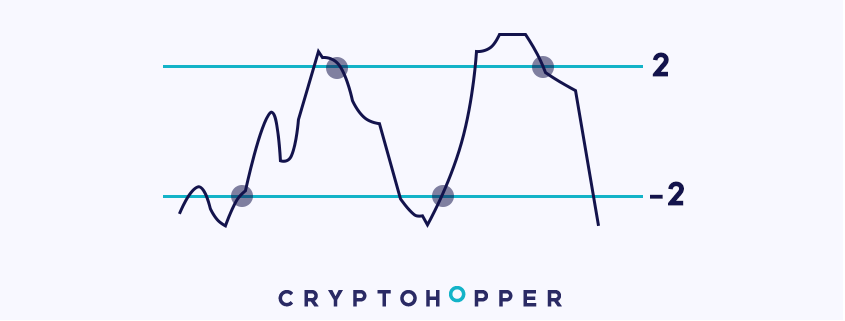
The Percent Change indicator measures how much a coin has moved percentage-wise over a specific number of periods. For example, a 4h chart with a period of 5 looks back 20 hours. Selecting "greater than" or "less than" produces sticking signals — the indicator keeps signaling as long as the condition is true. Enter positive values as positive numbers and negative values as negative (e.g. 2 = 2%, -2 = -2%).
Percentage Price Oscillator (PPO)
The PPO looks and works almost identically to the MACD, but is slightly more reactive. A buy signal is generated when the fast moving average crosses above the slow one (histogram turns green); a sell signal when it crosses below (histogram turns red). Non-sticking signals — sent only at crossovers.
Rate Of Change (ROC)
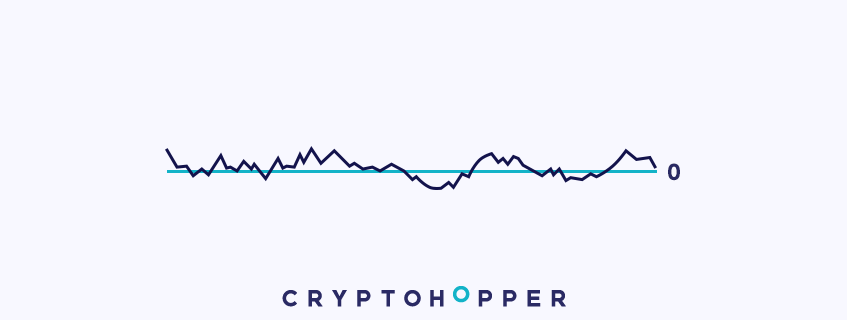
The ROC is a momentum indicator that measures the percentage change between the current price and a past price. A buy signal is generated when momentum turns positive (line crosses above 0); a sell signal when momentum turns negative (line crosses below 0).
Relative Strength Index (RSI)
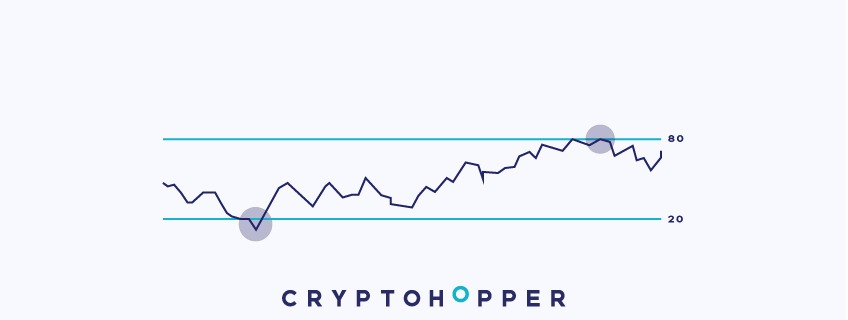
Invented by J. Welles Wilder, the RSI is a momentum oscillator that identifies overbought and oversold zones. On Cryptohopper you can set it to signal above or below any value, and even inverse signals to make it work as a trend-following indicator. Selecting "greater than" or "less than" produces sticking signals — making the RSI a great indicator to combine with others.
RSI With Region Crossovers
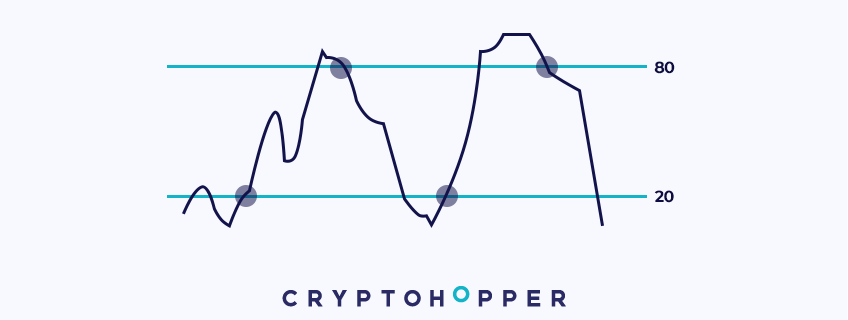
The RSI with Region Crossovers shares the same values as the regular RSI but works differently. It has two modes:
Signal on region IN (default) Sends a buy signal when the RSI crosses back above the oversold threshold (e.g. above 30 after being below it). Sends a sell signal when the RSI crosses back below the overbought threshold (e.g. below 70 after being above it).
Signal on region OUT Works like the regular RSI — sends a buy signal when the RSI crosses below the threshold, and a sell signal when it crosses above.
Simple Moving Average (SMA)
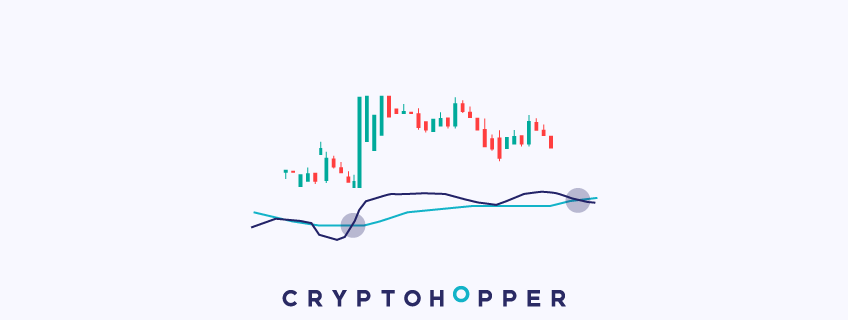
The SMA is a common trend indicator that smooths price movements. A fast SMA crossing above a slow SMA generates a buy signal; crossing below generates a sell signal.
Stochastic (Stoch)
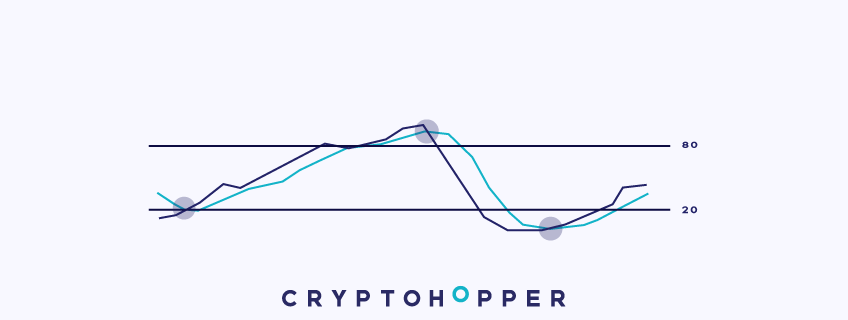
The Stochastic, developed by George C. Lane, is a momentum indicator similar to the RSI but more volatile. On Cryptohopper, the %K and %D lines are averaged. You can set it to signal above, below, or equal to any value, and even inverse the signals. Selecting "greater than" or "less than" produces sticking signals.
Stochastic RSI (StochRSI)
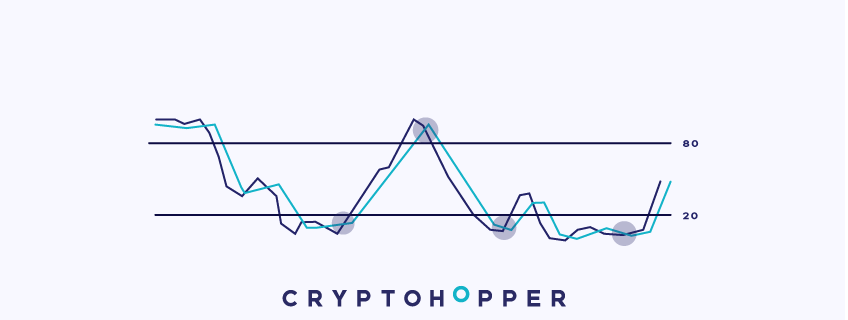
The StochRSI applies the Stochastic formula to RSI values, making it more volatile than the standard Stochastic. On Cryptohopper, the %K and %D lines are averaged. Works the same as other oscillators — you can set it to signal above, below, or equal to any value. Selecting "greater than" or "less than" produces sticking signals.
Stochastic With Region Crossovers
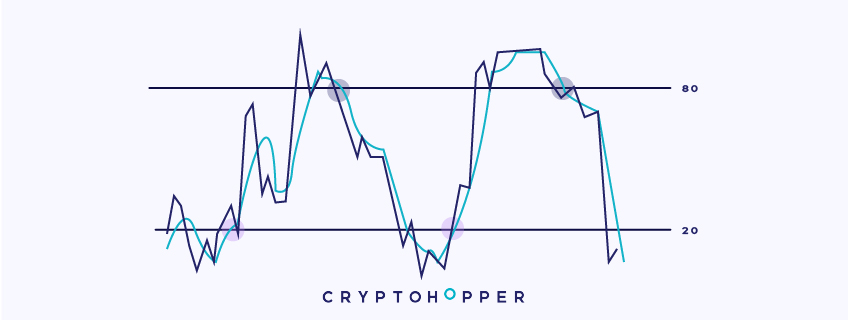
The Stochastic with Region Crossovers shares the same values as the regular Stochastic but works differently. The %K and %D lines are averaged. It has two modes:
Signal on region IN (default) Sends a buy signal when the Stochastic crosses back above the oversold threshold. Sends a sell signal when it crosses back below the overbought threshold.
Signal on region OUT Works like the regular Stochastic — sends a buy signal when the Stochastic crosses below the threshold, and a sell signal when it crosses above.
Stochastic with Region Crossovers is only available to Hero subscribers.
StochRSI With Region Crossovers
The StochRSI with Region Crossovers shares the same values as the regular StochRSI but works differently. The %K and %D lines are averaged. It has two modes:
Signal on region IN (default) Sends a buy signal when the StochRSI crosses back above the oversold threshold. Sends a sell signal when it crosses back below the overbought threshold.
Signal on region OUT Works like the regular Stochastic — sends a buy signal when the StochRSI crosses below the threshold, and a sell signal when it crosses above.
StochRSI with Region Crossovers is only available to Hero subscribers.
Ultimate Oscillator (UO)
Developed by Larry Williams in 1976, the UO combines short, medium, and long-term periods to measure momentum — making it less volatile than single-period oscillators. On Cryptohopper you can set it to signal above, below, or equal to any value, and inverse the signals. Selecting "greater than" or "less than" produces sticking signals.
Tilson Moving Average (T3)

Developed by Tim Tillson, the T3 is a fast trend indicator with less lag than most moving averages. It includes several EMAs of another EMA and adds a volume factor between 0 and 1. Buy and sell signals are generated through crossovers.
Time Series Forecast (TSF)
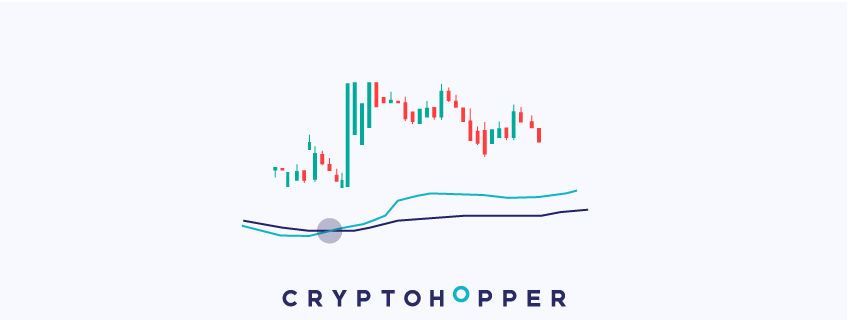
The TSF is a trend indicator that uses linear regression to forecast the next price period, reducing the lag of a normal moving average. Signals are generated through crossovers between the TSF line and a moving average.
Triangular Moving Average (TMA)

The TMA is a trend indicator that has been averaged twice — it is the SMA of an SMA. This creates a very smooth moving average that filters out noise and pinpoints the main trend. Buy and sell signals are generated through crossovers.
Triple Exponential Moving Average (TEMA)

Developed by Patrick Mulloy, the TEMA is one of the fastest moving averages available. It includes several EMAs in its calculation to smooth fluctuations while minimising lag. Buy and sell signals are generated through crossovers between a fast and slow moving average.
Weighted Moving Average (WMA)

The WMA is a fast trend indicator that assigns greater weight to the most recent periods. It is faster than the SMA and EMA but slower than the DEMA. Buy and sell signals are generated through crossovers between a fast and slow moving average.
Williams Percentage R (%R)
Developed by Larry Williams, the Williams %R is a momentum indicator oscillating between -100 and 0. The overbought zone is between -20 and 0; the oversold zone between -100 and -80. On Cryptohopper you can set it to signal above, below, or equal to any value, and even inverse the signals. Selecting "greater than" or "less than" produces sticking signals — making it a great indicator to combine with others.