What is on the Chart page
An explanation of everything available on the Cryptohopper Charts page.
Overview
The Charts page gives you access to TradingView charts directly within Cryptohopper. Select your exchange and trading pair, then click "Go" to load the chart.
Draw on the chart with the easy tools
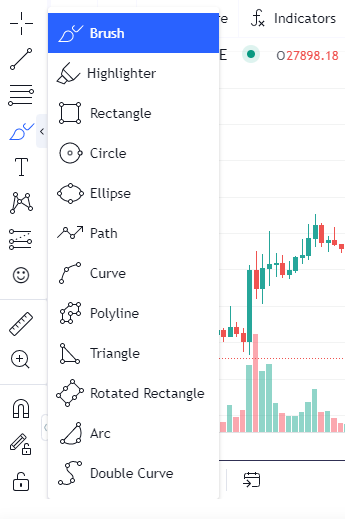
A set of basic drawing tools is available on the left side of the chart. These include:
- Cross — a simple crosshair cursor for reading chart values.
- Trend line — draw a straight line between two points to identify trend direction.
- Fib retracement — draw a Fibonacci retracement between two points to identify potential support and resistance levels.
- Rectangle — draw a rectangle on the chart to highlight a specific price range or area.
- Remove — remove a selected drawing from the chart.
Draw on the chart with the complex tools
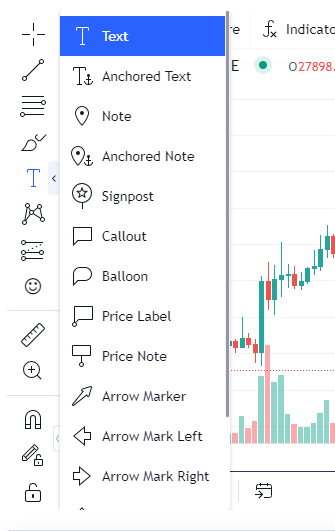
Access more advanced drawing and analysis tools by clicking the expand icon on the toolbar. These additional tools include a wider range of trend lines, shapes, Fibonacci tools, and annotation options available through the full TradingView toolbar.
Markets tab
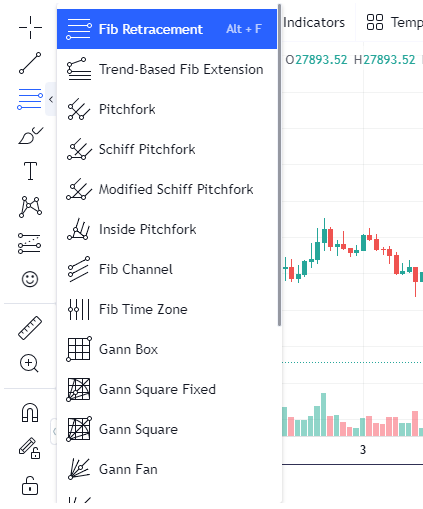
The Markets tab shows an overview of all available trading pairs for your selected exchange. For each pair you can see:
- Last price — the most recent trade price.
- Change — the percentage price change over the last 24 hours.
- Volume — the 24-hour trading volume.
Use this tab to quickly identify active markets and find pairs with sufficient volume before configuring your bot.
Signals tab
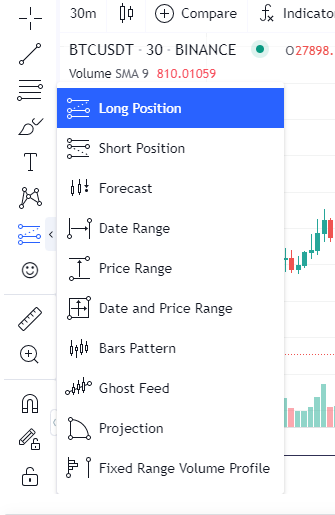
The Signals tab shows the most recent signals sent by Signalers you are subscribed to. For each signal you can see:
- The currency the signal was sent for.
- Whether it was a buy or sell signal.
- The date and time it was sent.
- The rate at which the signal was sent.
- The performance result at 15 minutes, 1 hour, and 24 hours after the signal.
Click on a signal to load that trading pair directly in the chart — useful for reviewing the market conditions at the time the signal was sent.