What is on the Chart page
This tutorial explains what you can find on the Chart page.
Draw on the chart with the easy tools
There are multiple tools you can use to draw on the chart. We will go over the easy tools first.
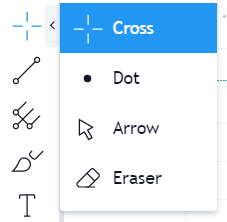
Cross, Dot, and Arrow
Shows the price level on the vertical axis and on the horizontal axis. The only difference is between the 3 aesthetics.
Eraser
Use this to delete any previously made drawings just by clicking on them.
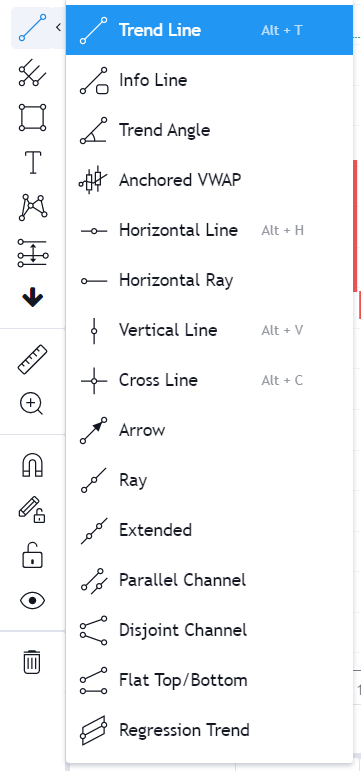
Trendline, Horizontal Line, Horizontal Ray, Vertical Line, Cross Line, Arrow, Ray, Extended, Parallel Channer, Disjoint Channel, Regression Trend
These are all simple drawing tools to help you draw out your analysis.
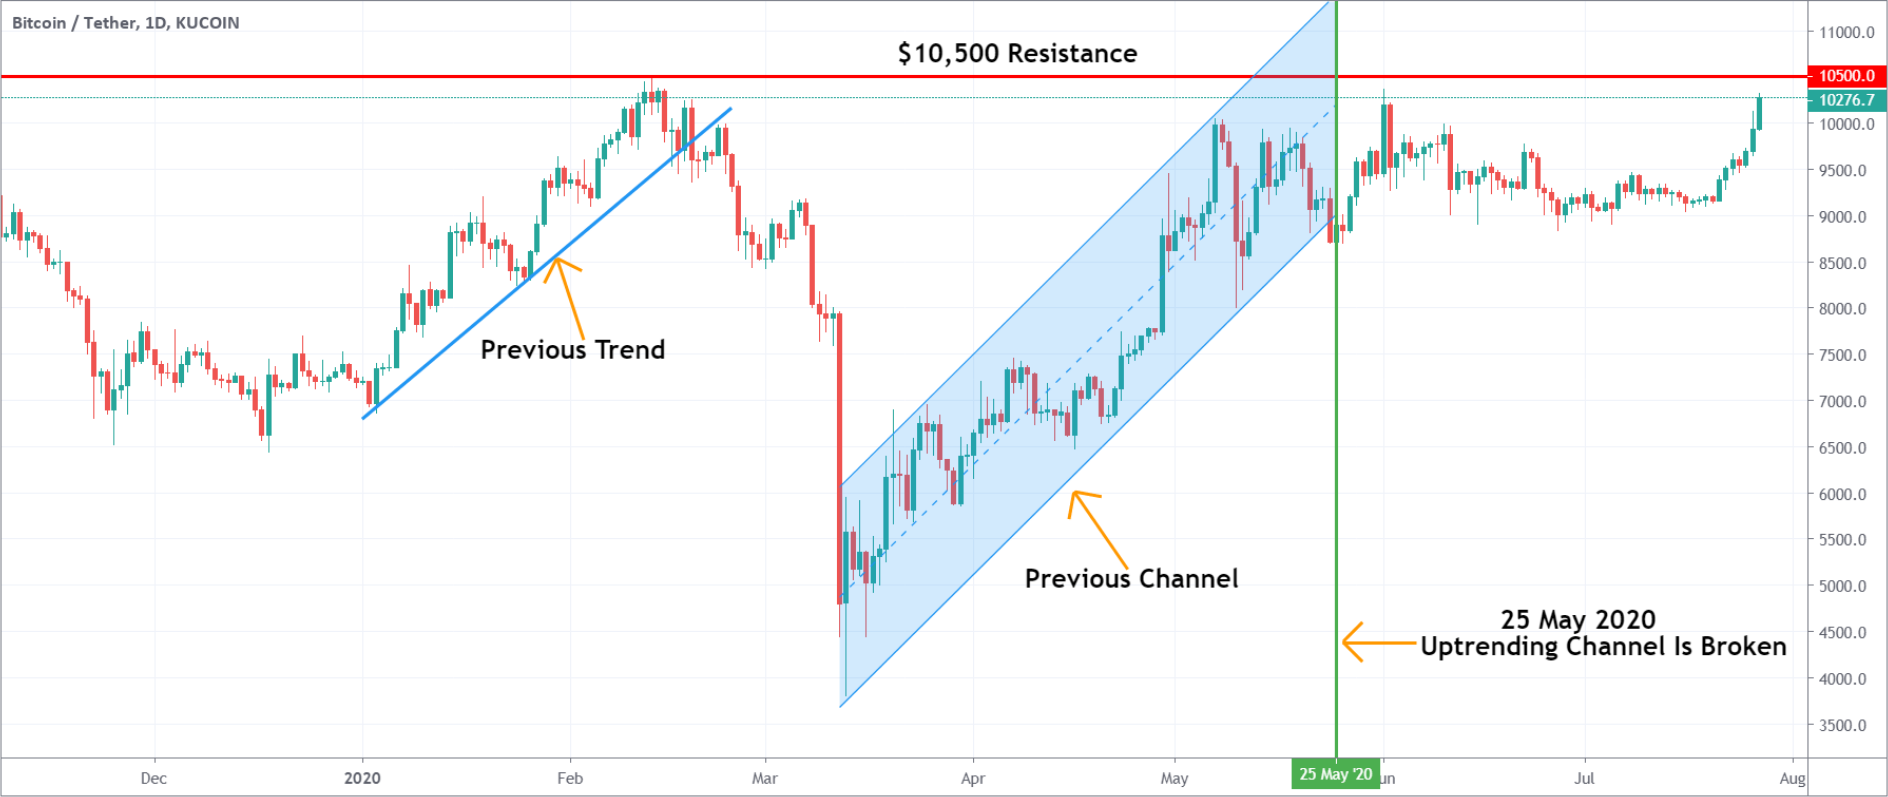
For example, Regression Trend
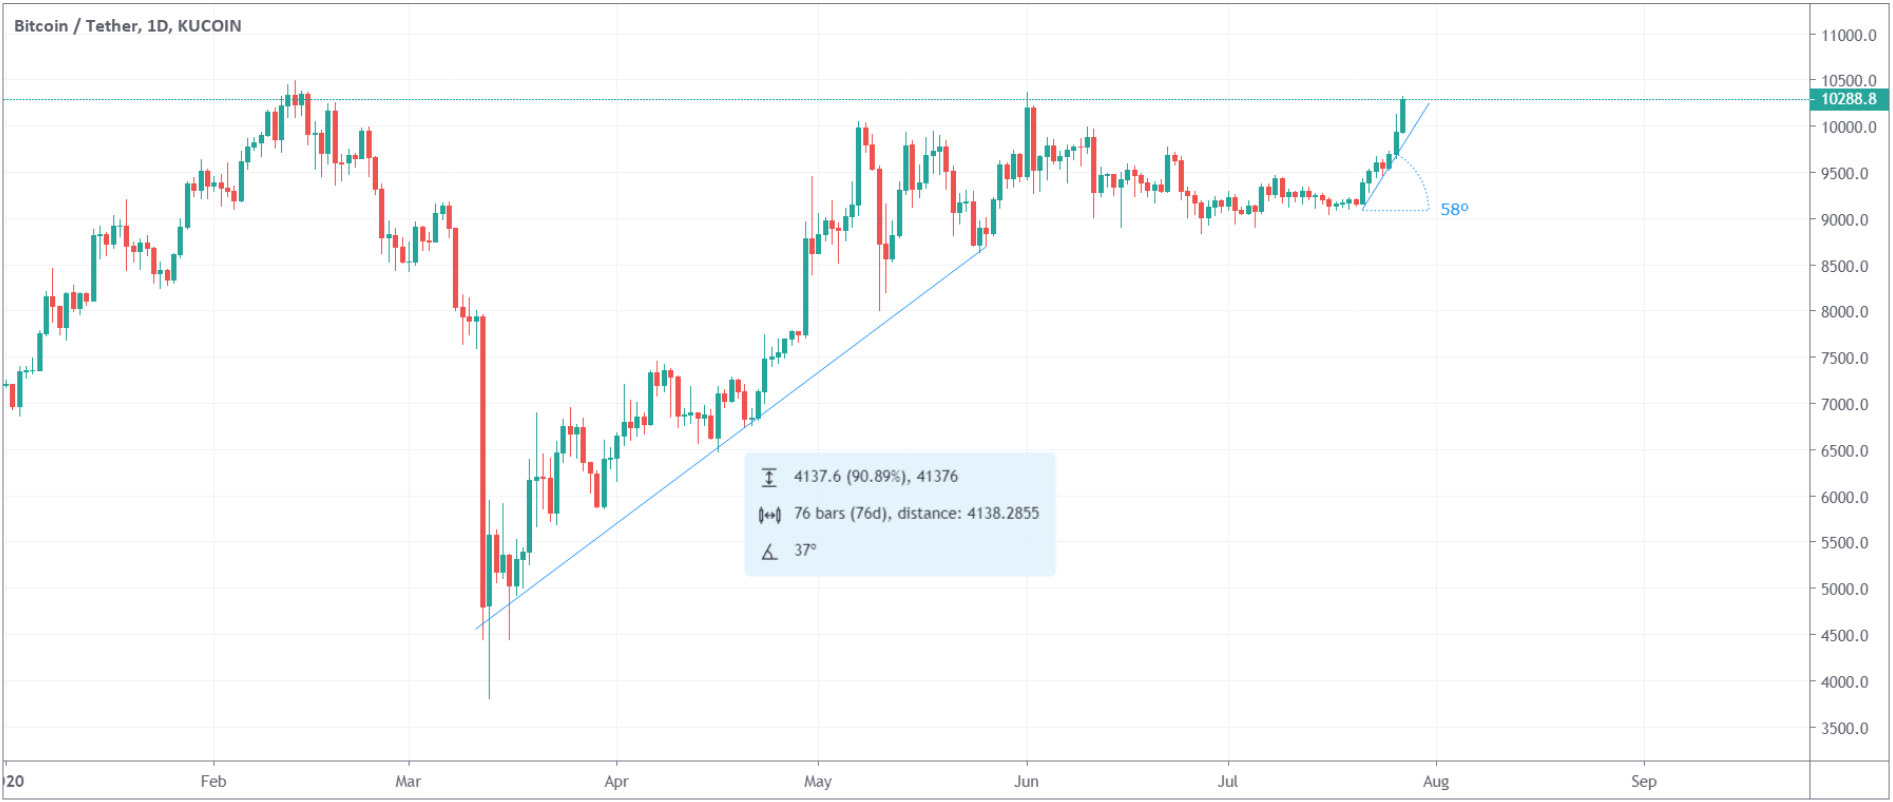
Another example, Info Line & Trend Angle.
The info line displays the percentage growth or loss between two points as well as the distance (in both time and candles) and the angle of the trend. The trend angle simply provides the angle of the trend.
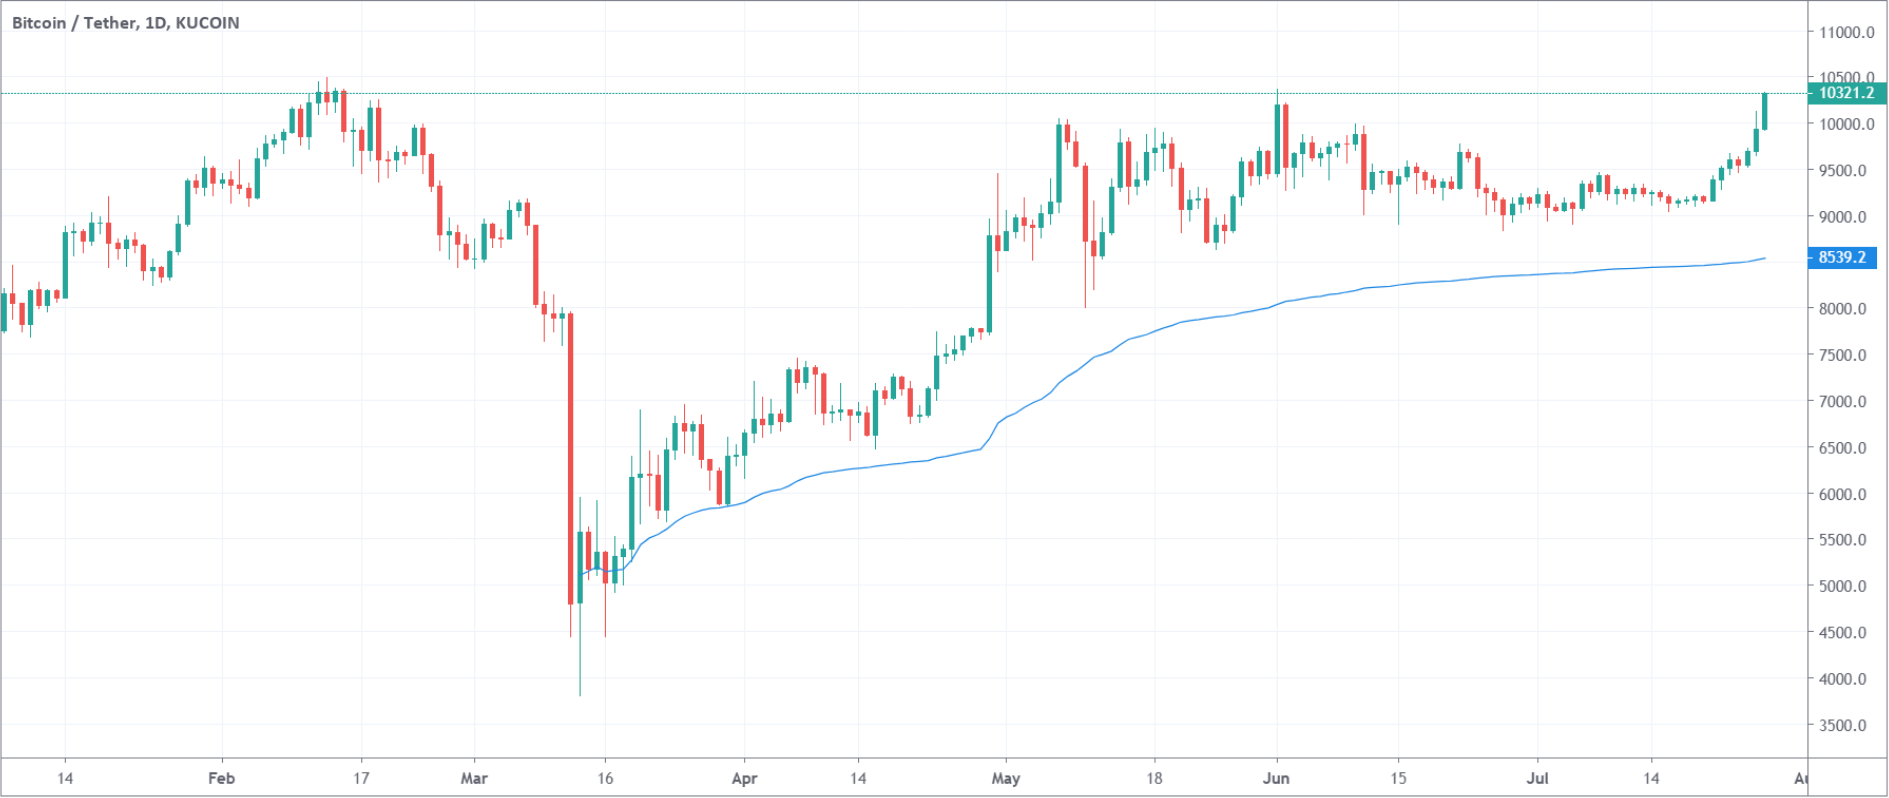
Last example, Anchored VWAP.
Shows the volume-weighted average price (VWAP) for a specific period. Click on the drawing tool, and then on any point on the graph to have the VWAP show up, until the latest price. You can treat the VWAP as a moving average by which you can analyze whether you are in a bullish market or a bearish one. This tool is useful because you can add it to longer inter-day timeframes (which is not possible with the regular VWAP indicator).
Draw on the chart with the complex tools
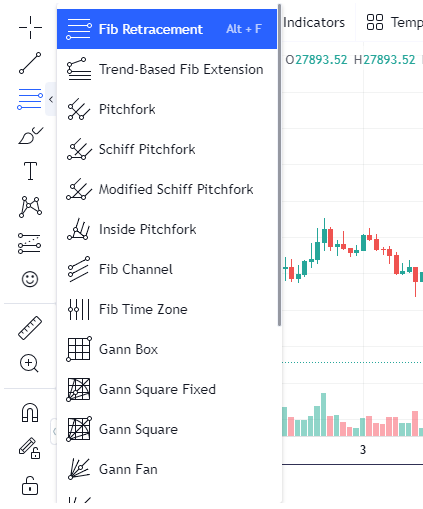
Besides the easy tools there’re also more complex tools. You can find many different Fibonacci, Gann, and Pitchfork types.
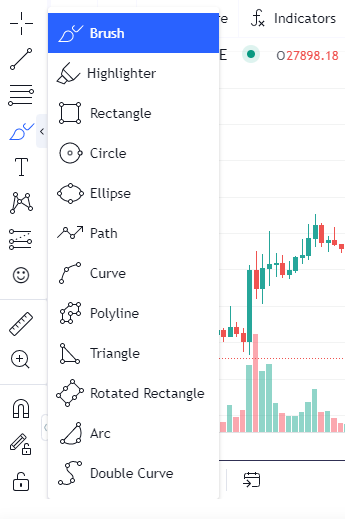
Drawing section
Useful when creating geographic figures.
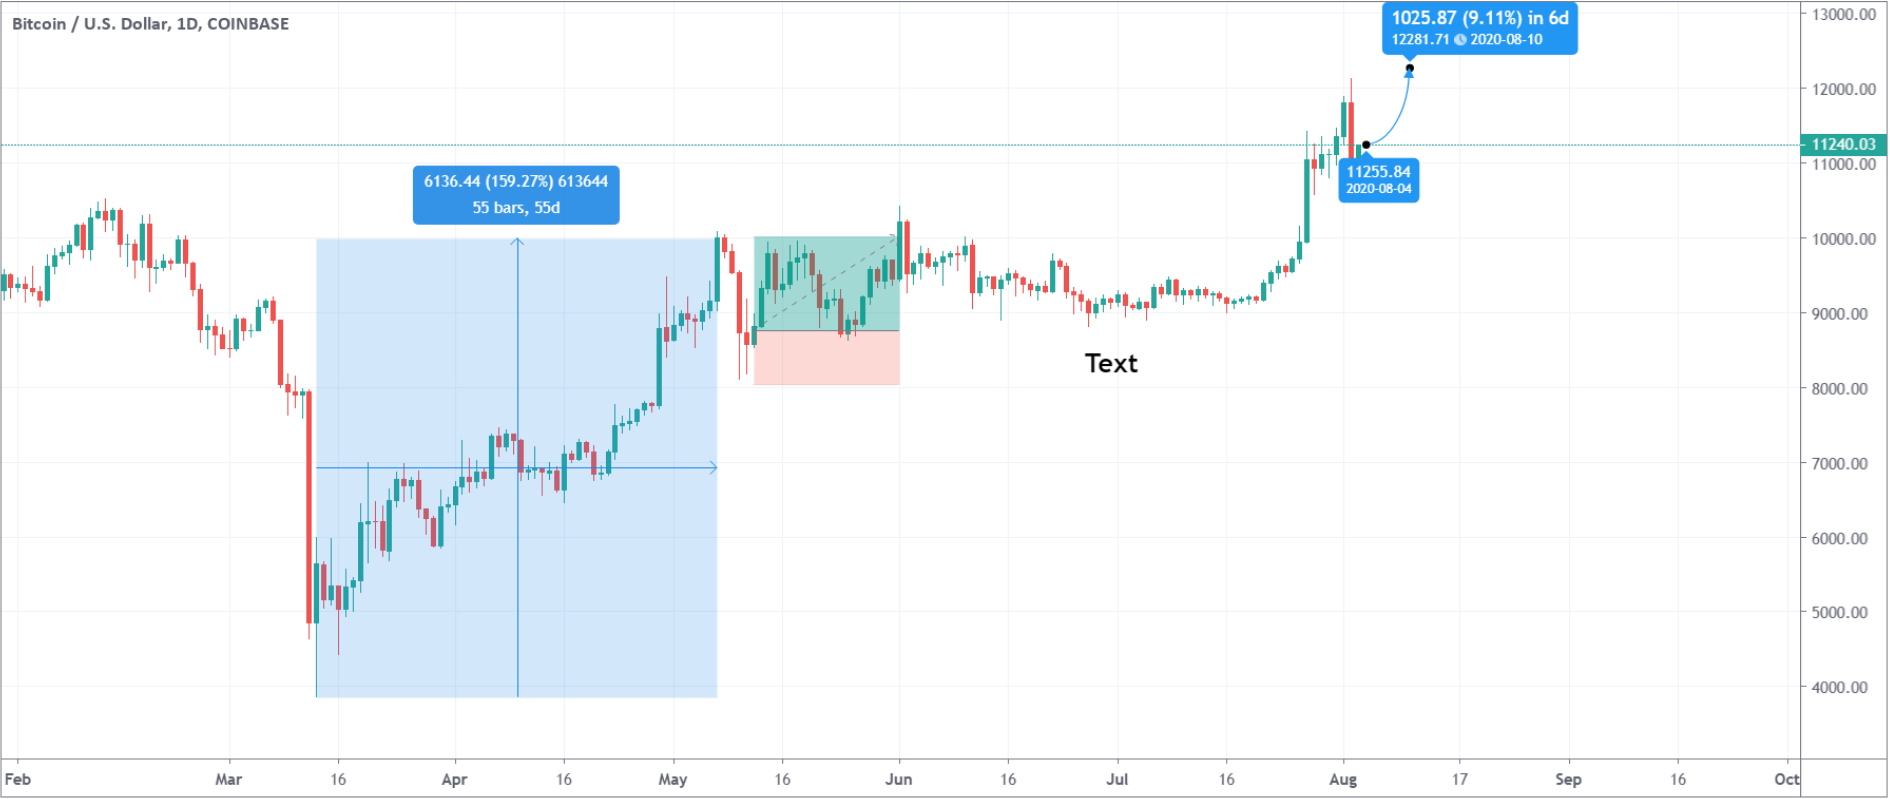
For example, use the rectangle to draw support and resistance levels. The triangle for the bearish and bullish triangle patterns. The circles to pinpoint breakthroughs, etc.
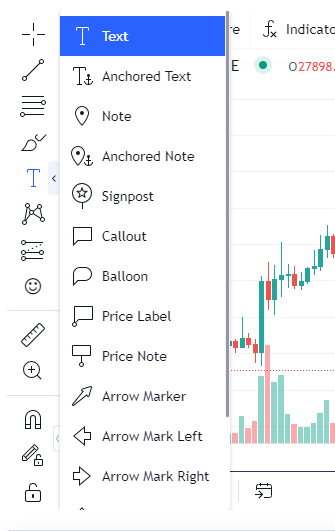
Text drawing tools
Use this to write important notes on your chart. Simply click on the text button, then on the chart, and write out whatever you desire.
Patterns
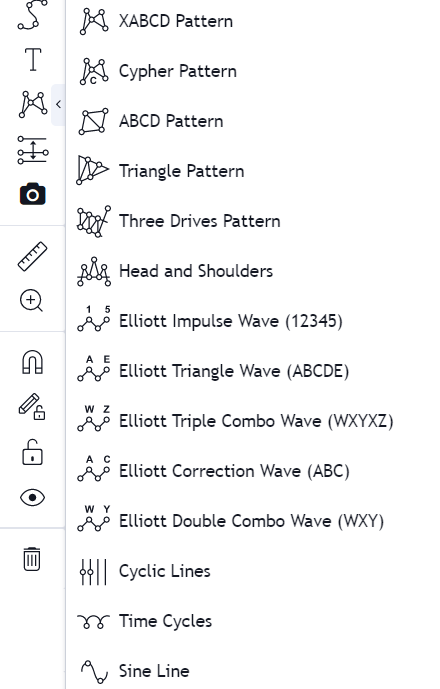
Use this section to draw out chart patterns such as the triangle pattern, Head and Shoulders, ABCD, etc.
Projection
Use this section to make future projections.
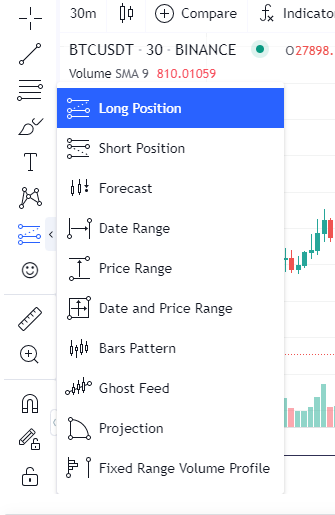
For example, use the "Forecast" and "Projection" tools to make predictions about where the price may head in the future. You can use the "Date and Price Range" to see how long it took the price to reach a certain percentage. The "Long Position" and "Short Position" can be used to either predict the profitability of a position or to manually backtest how a strategy would have performed in the past.
Smiley
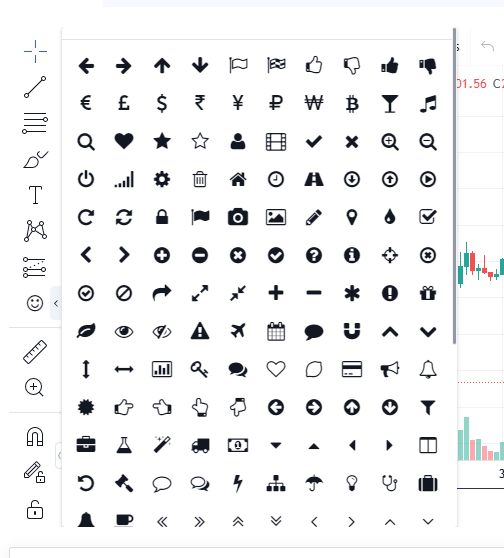
Use this to insert pre-made pictures on your chart. Mostly used when creating content.
Extra information
Below the chart, you have 2 additional tabs.
Market tab
Shows details about the last price, highest bid, lowest ask, the spread, volume, and the volume in the currency selected.
Order book tab
Shows the 5 highest bid and the 5 lowest ask orders, the amounts of the orders, and the total cost. The order book changes at all times. When a large order gets filled it can result in a high upward or downward move.
Markets tab
Markets
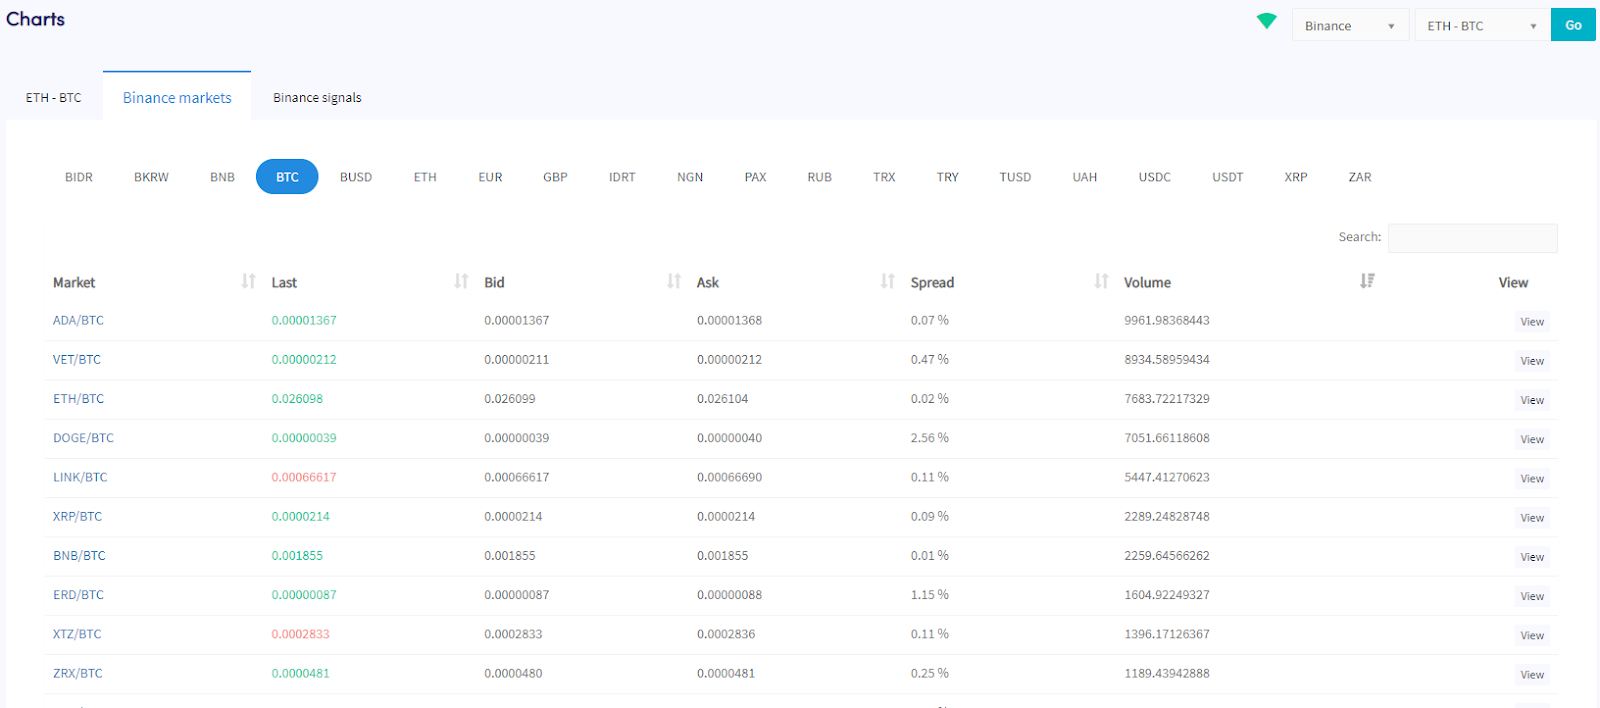
You can find the Markets tab on top of the Chart page. It shows all quote currencies available on the exchange you selected. You find all the trading pairs that can be traded with the quote currency. The currencies that you see are the currencies you selected under “Coins and Amounts” in the Configuration/Baseconfig.
Under the Markets tab, you find the following information:
Market
Shows the currencies that you can trade with the chosen quote currencies.
Last
Shows the latest buy or sell rate the trading pair got traded for.
Bid
Shows the highest rate someone is willing to buy the currency for at that moment. Meaning these are the first orders to be filled when a seller places a Market order. When a Limit order has been placed, it could mean that this order won't be filled as there could be new buyers that are willing to pay more for the same currency.
Ask
Shows the opposite of the Bid quotes. It shows the lowest rate someone is willing to sell the currency for at that moment. These are also the first orders to be filled when a buyer places a Market order. When a Limit order has been placed, it could mean that this order won't be filled as there could be new sellers that are willing to receive less for the same currency.
Spread
It’s the difference between the highest bid and lowest ask order. The spread could be especially useful to determine which currency you select for the?Market Making bot. For an explanation of the Market-Making bot, click here.
Volume
Is shown in the Quote currency. In the example above, you see that for ADA a value of 9,961 BTC has been traded during the last 24 hours. When there is a high trading volume, there is a higher chance that your limit orders will be filled. Liquidity is another important metric that is linked to volume It refers to the order sizes and rates of the buy and sell orders shown in the order book. Keep in mind that currencies that do not have a filled order book could be used for pump and dumps schemes. A pump and dump scheme comes down to suddenly buying the whole order book of currency to let the price increase significantly. When other traders get FOMO (Fear Of Missing Out) and place buy orders, the original buyers will then dump their coins and reap profits.
Signals tab
You can find the Signals tab on top of the Chart page.
Under the Signals tab, you find the following information:
Market
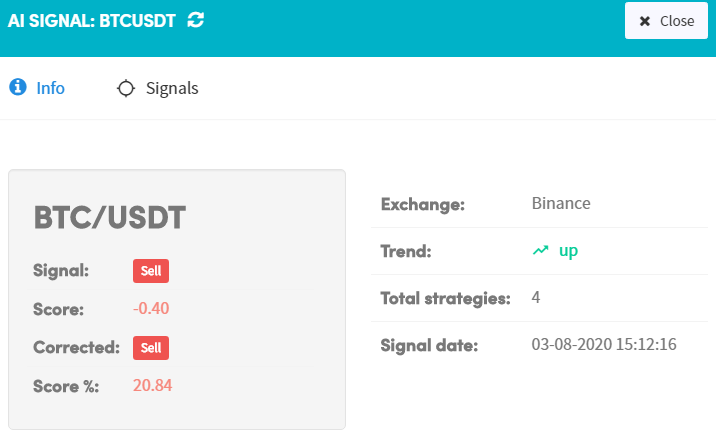
Shows the specific markets that your AI is sending signals to. You only see coins that you have selected in your Baseconfig. For example, you have selected BTC, ETH, XRP, and LINK in your Baseconfig. You will only see those 4 coins here when the AI will be signaling a buy or a sell.
AI
Shows the name of your AI Strategy.
Trend
Shows you what trend the market is in right now according to your AI Strategy. In the example above, you can see that it is in an uptrend.
Price
Shows the actual price of the currency(s) at the moment.
Signal
Shows if it’s a buy or a sell.
Score
Shows the underlying value for the Signal. It shows the "normal score" and NOT the corrected score.
Corrected signal
Shows if it’s a buy or a sell based on your corrected score.
Score %
Shows the underlying value of the corrected Signal.
Lowest
Shows the lowest “normal” score for the Signal.
Highest
Shows the highest “normal” score for the Signal.
Signals
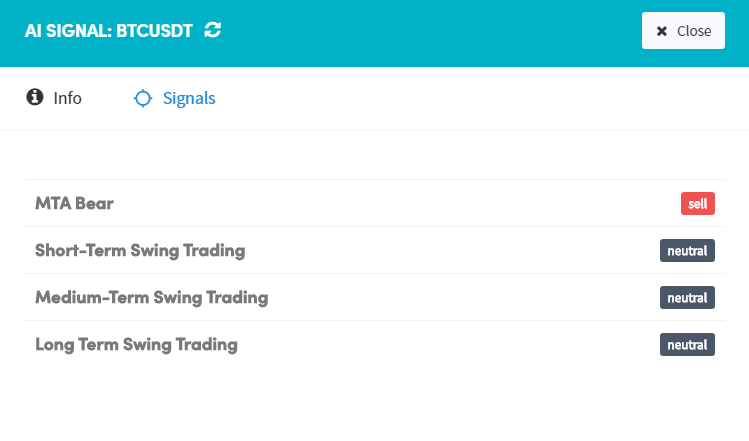
Shows the number of signals given. This number is the same as the number of all of your Signal Strategies. All strategies will signal: buy, sell, or neutral.
View
Click here to see all the information available.

