What are Your Stats
An explanation of every chart and metric on the Your Stats tab.
Stats
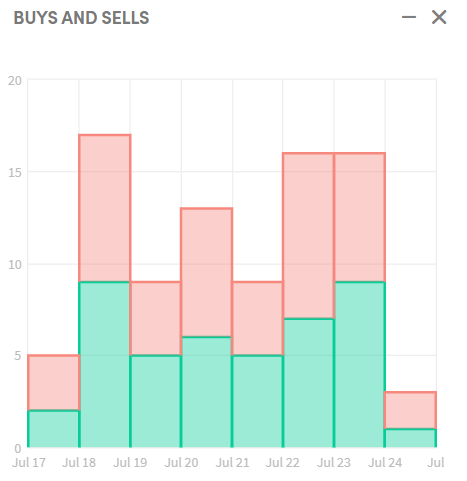
Buys and sells A comparison of buy orders versus sell orders over time, shown by day.
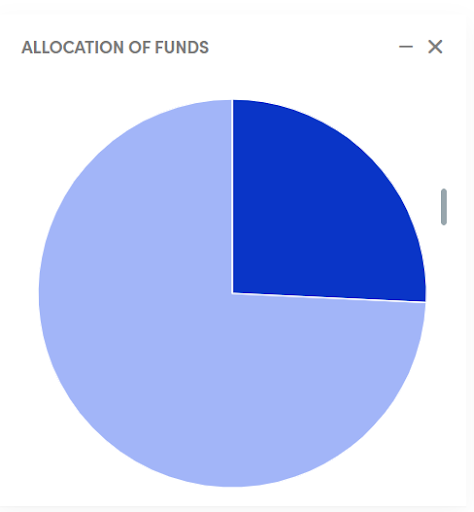
Allocation of funds A breakdown of your current portfolio composition. Hover over the chart to see the percentage per currency.
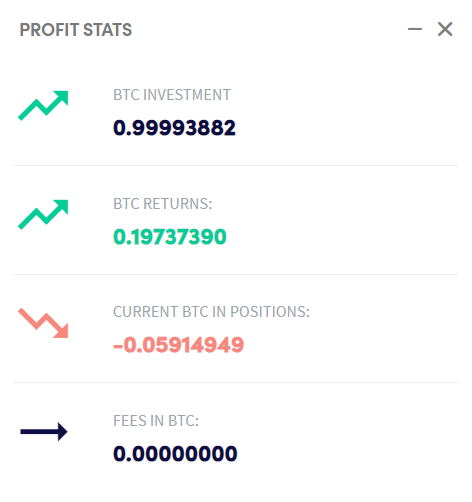
Profit stats An overview of your trading performance — investment made, returns, and the current profit and loss across open positions. Note: paper trading bots do not show fees.
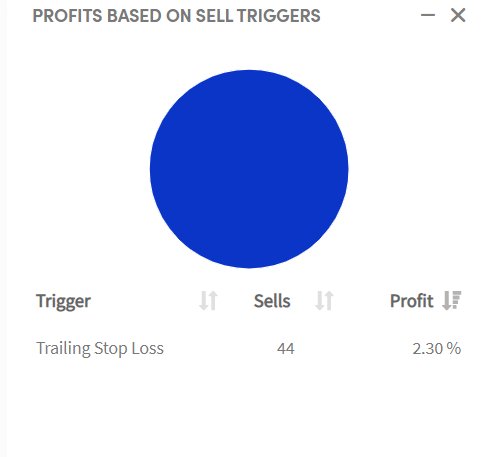
Profits based on sell triggers Shows which sell trigger generated the most profit or loss — for example, Take Profit, Stop-Loss, Strategy, or Auto-close.
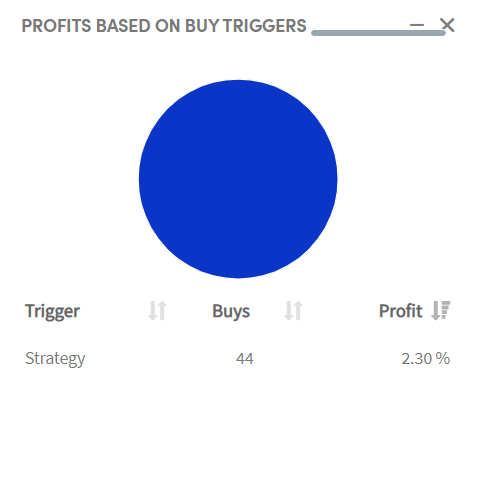
Profits based on buy triggers Shows where buy orders are coming from — Strategies, Signals, DCA, and so on.
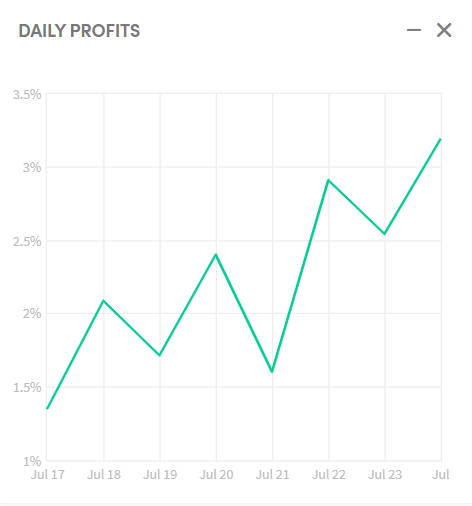
Daily profits How much was made each day, based on sell trades only. Buy trades are not included in this chart.
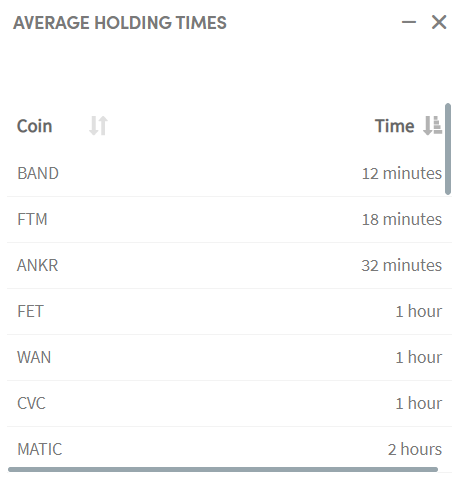
Average holding times How long positions are held on average, broken down by coin.
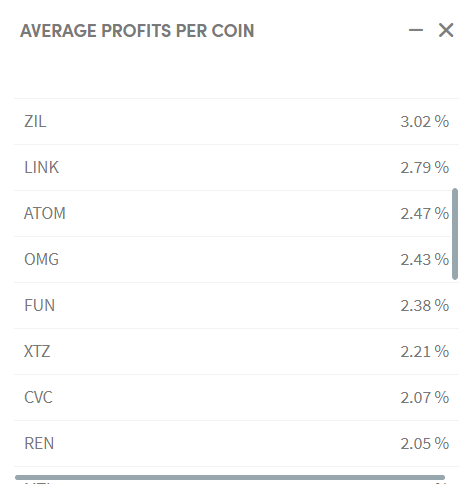
Average profits per coin The average profit or loss per coin across all completed trades.
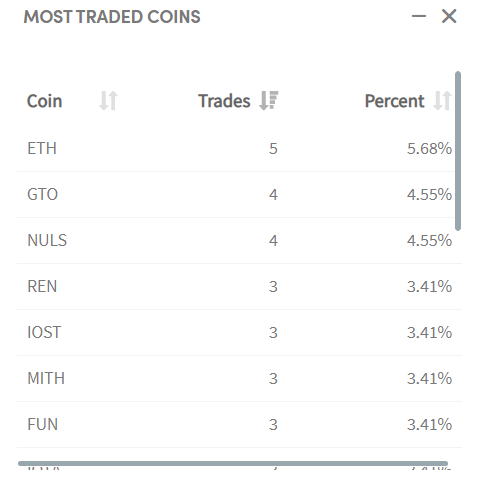
Most traded coins The coins that have been bought and sold the most.
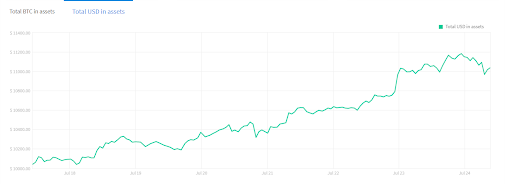
Total in assets The growth of your portfolio expressed in your quote currency over time.
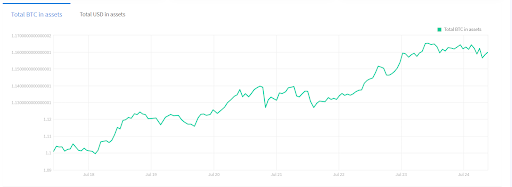
A second tab shows the same data in USD.