What are Technical Indicators
An explanation of what Technical Indicators are and the four different types used in Cryptohopper.
What are Technical Indicators?
Technical Indicators are mathematical calculations based on historical price and volume data. Traders use them to analyse market conditions and forecast future price movements. On Cryptohopper, Technical Indicators are used in the Strategy Builder to determine when your bot should buy or sell.
There are four types of Technical Indicators:
Trend indicators

Trend indicators help identify the direction of the market — whether it is moving up, down, or sideways. They are most useful in trending markets and less reliable in ranging markets. Common examples include the EMA, SMA, and MACD.
Momentum indicators
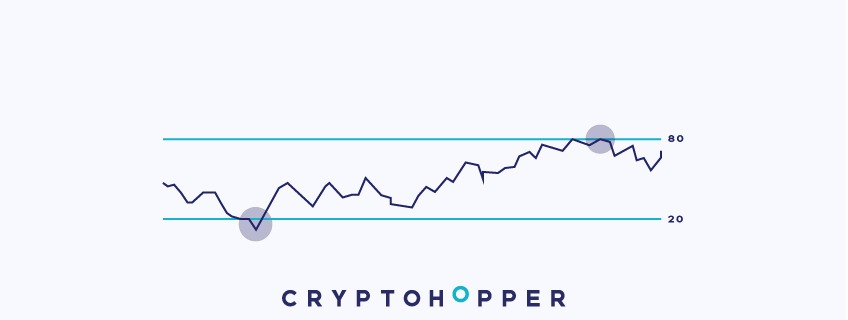
Momentum indicators measure the speed of price movements and help identify overbought or oversold conditions. They are particularly useful for spotting potential reversals. Common examples include the RSI, Stochastic, and Williams %R.
Volatility indicators
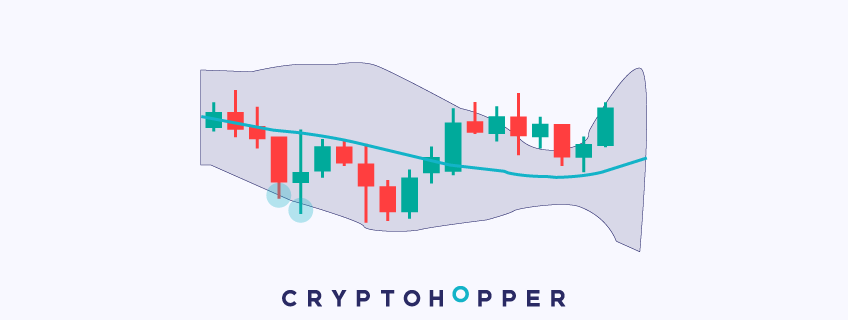
Volatility indicators measure how much the price is fluctuating over a given period. High volatility signals large price swings; low volatility signals a quieter market. Common examples include Bollinger Bands and the ATR.
Volume indicators

Volume indicators incorporate trading volume into their calculations to confirm price movements or signal potential reversals. A price move accompanied by high volume is generally considered more reliable. Common examples include the OBV and the Chaikin A/D Oscillator.